Latent Pet Affinity Versus Actual Ownership Readiness in Philippines
Pet ownership sits at the intersection of lifestyle, household economics, and personal preference. In the Philippines, attitudes toward pets are shaped by a range of practical constraints alongside genuine emotional attachment, making the relationship between affection for pets and the ability or willingness to own one a particularly relevant area of consumer understanding.
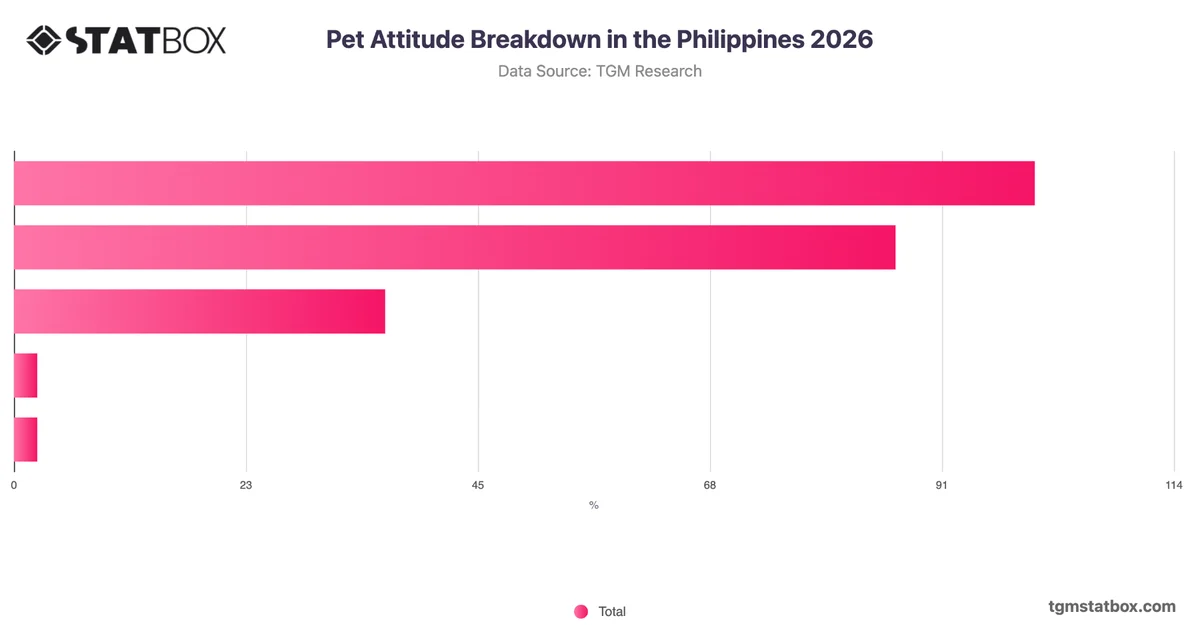
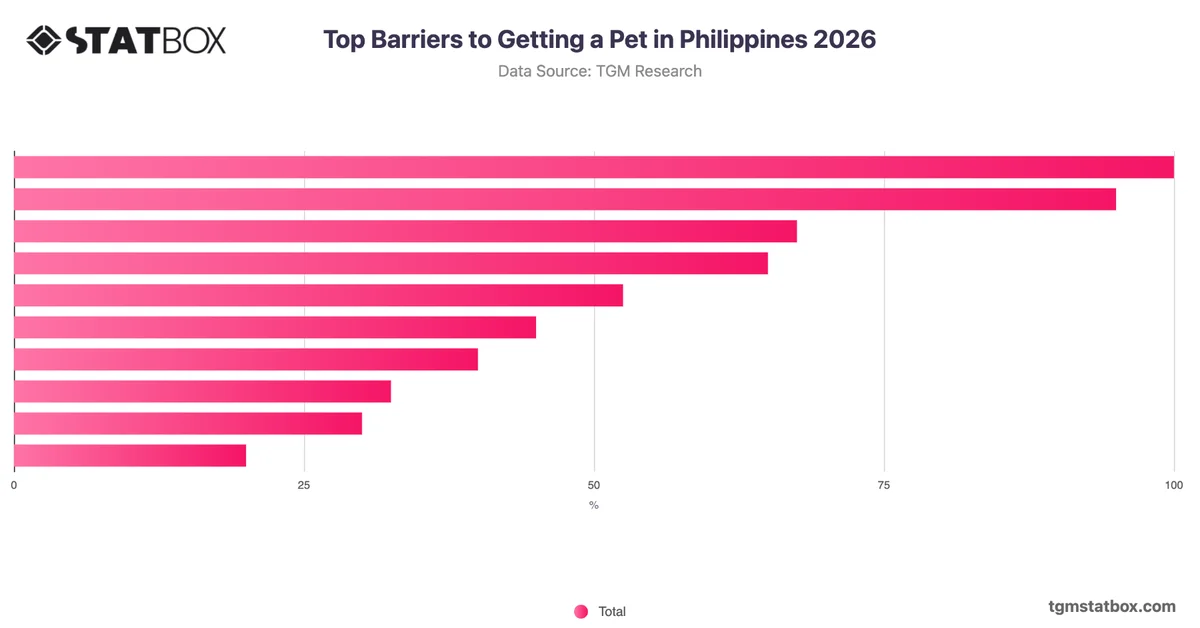
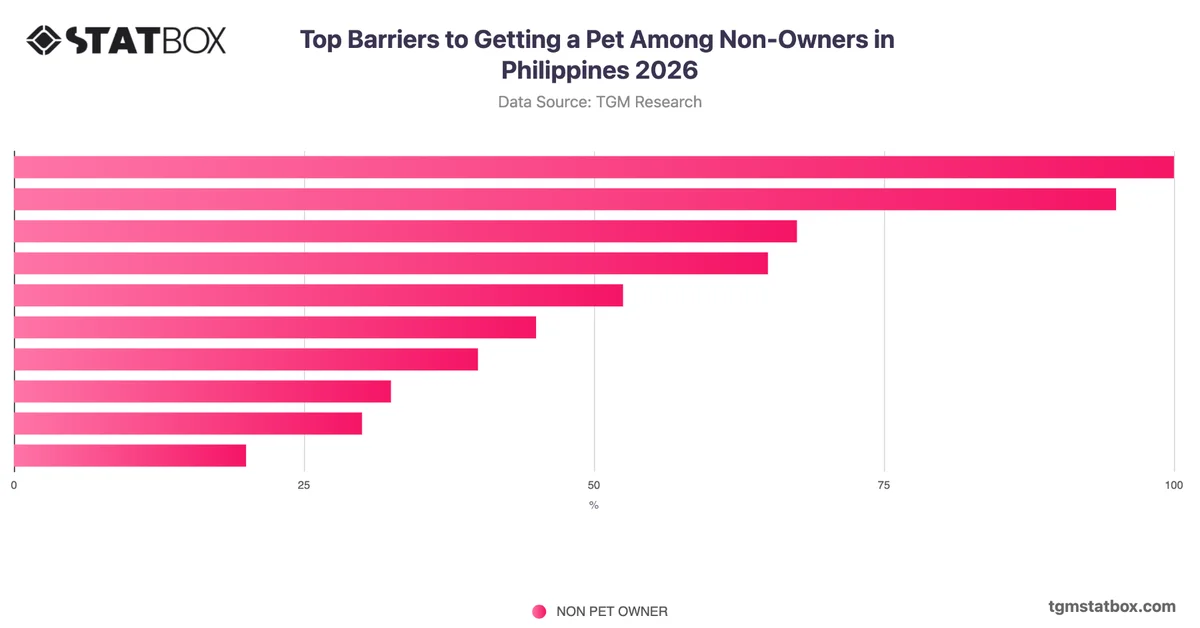
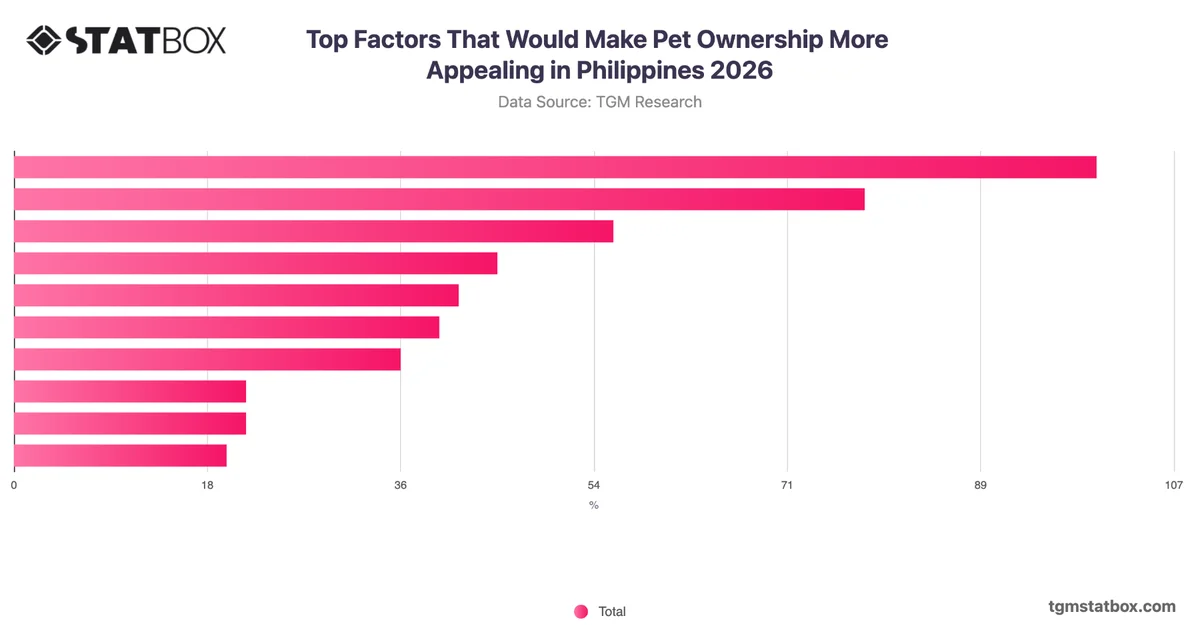
The most analytically significant pattern in Filipino pet attitudes is the pronounced gap between affinity and ownership readiness. Nearly half of respondents express love for pets yet cite current circumstances as a barrier to ownership, a figure that dwarfs every other response category. Combined, those who appreciate pets in some form account for the clear majority, yet active ownership intent remains constrained. Indifference and aversion are marginal, with neutrality at 15% and dislike or fear accounting for only 6% collectively. This points to a market where latent demand is substantial but situational barriers, whether financial, residential, or logistical, are suppressing conversion. For organisations in pet retail, services, or adoption, the priority should be investigating which specific barriers are most prevalent among the affinity-but-not-owning segment, as addressing those directly may be more effective than broad awareness efforts.