Latent Pet Affinity Versus Practical Ownership Barriers in South Korea
Pet ownership sits at the intersection of lifestyle preferences, household constraints, and personal values. In South Korea, decisions around keeping pets are shaped by a range of practical, financial, and living-situation factors that can create a meaningful gap between how people feel about pets and whether they choose to own one.
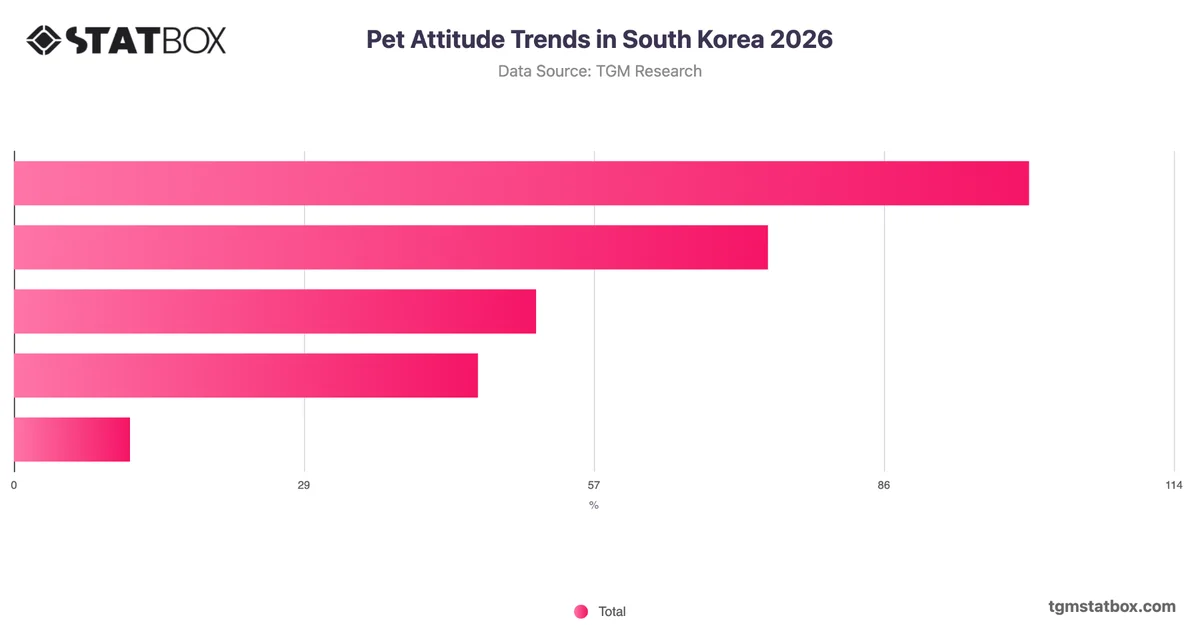
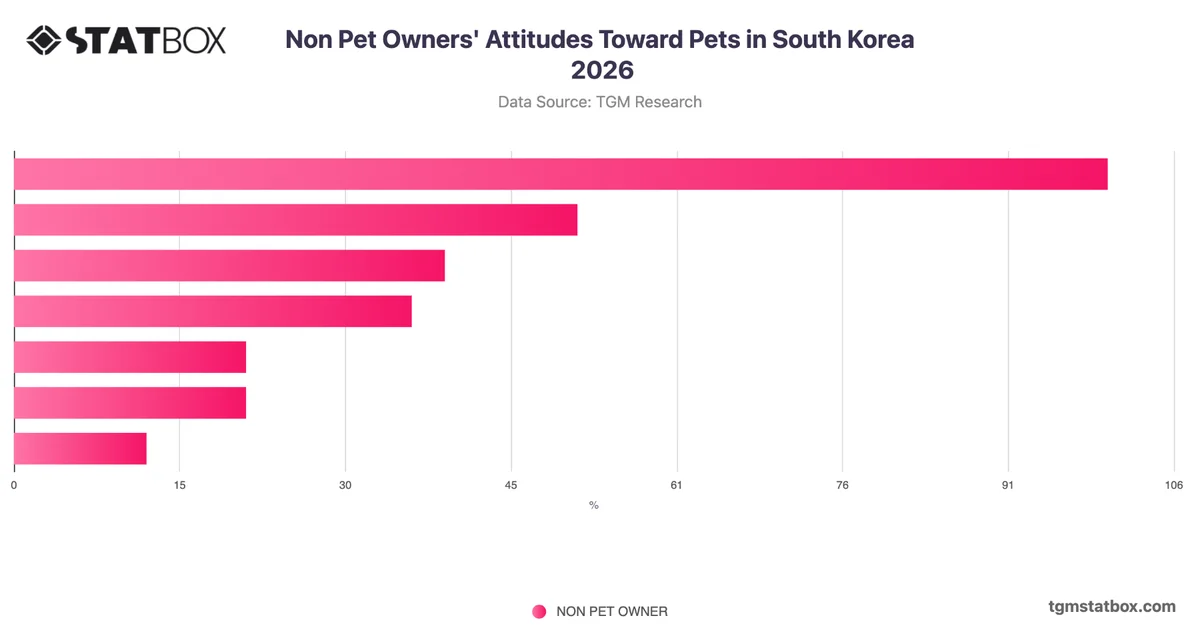
The most analytically significant pattern in South Korean pet attitudes is the gap between affection and ownership readiness. One in three respondents express genuine love for pets yet cite current circumstances as a barrier to ownership, making this the single largest attitudinal segment at 33%. Combined with the 17% who like pets but actively prefer not to own one, a clear majority hold positive or warm feelings toward pets without translating that into ownership intent. Outright indifference or aversion accounts for a comparatively smaller share, with neutrality at 13% and dislike at 12%. This structure suggests latent demand rather than a broadly engaged ownership market. For pet-related brands and service providers, the priority should be investigating what specific barriers prevent the affectionate non-owner segment from converting, as addressing those constraints may be more commercially productive than targeting already-committed owners.