Breadth of Pet Affinity Versus Depth of Commitment in China
Attitudes toward pets carry commercial weight across multiple industries, from food and veterinary services to retail and insurance. In a market as large and internally diverse as China, understanding the distribution of pet sentiment across the general population provides a foundation for category positioning, audience segmentation, and product prioritisation that goes beyond simple ownership metrics.
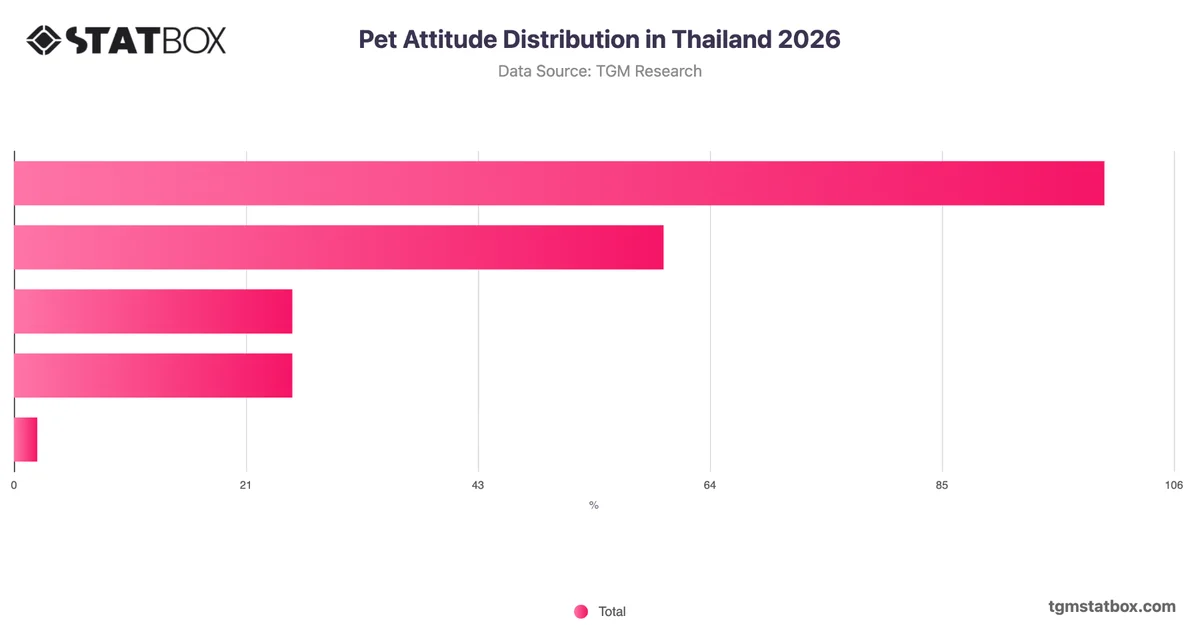
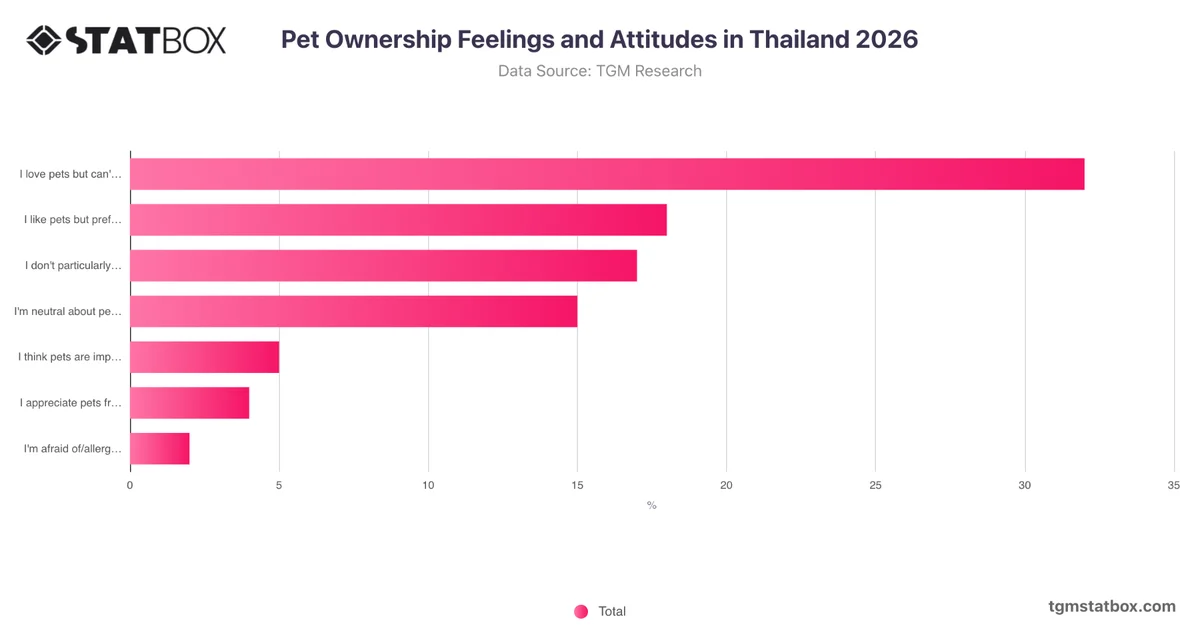
The most analytically significant pattern in the data is the gap between broad acceptance and unconditional affinity. While negative sentiment is marginal, with only 7% expressing dislike or aversion, strong universal love for pets applies to just over one in four adults. The largest single group, at 48%, holds conditional rather than categorical enthusiasm, liking some pets but not others. This concentration of selective attitudes, combined with 18% neutrality, points to a population that is largely open to pets without being deeply committed to them. For organisations operating in the pet category, this suggests that broad awareness campaigns are likely to encounter receptive but not inherently motivated audiences. More targeted communication strategies that address specific pet types or ownership scenarios may be better positioned to convert conditional interest into active engagement.