Share the statistic on social media channels or embed the statistic in your website using "Embed Code", where available.
Share chart
Embed chart Embed copied!Cite this statistic and select one of the following formats: APA, Chicago, Harvard, MLA & Bluebook
TGM Global Pet Care Survey 2023, TGM Research
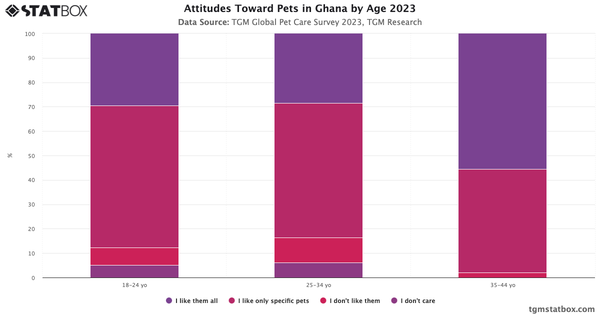
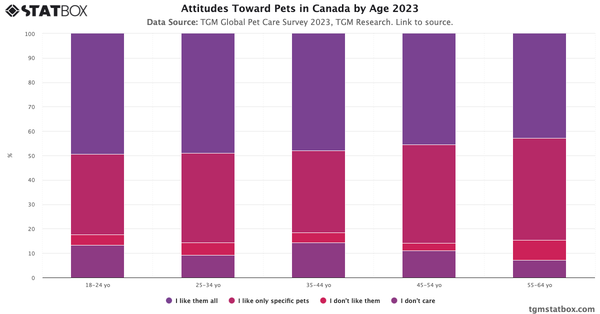
"What is your attitude towards pets?"
Key Takeaways
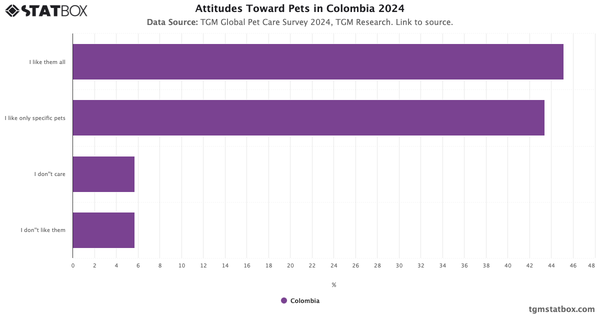
In Croatia, 54% of respondents express a universal love for all types of pets, reflecting a strong cultural affinity towards animals. This preference aligns closely with trends seen in Portugal and Serbia. 39% of Croatians prefer only specific pets, indicating a more selective attitude. This choice suggests a focus on certain animals that may align better with lifestyle or personal preferences. Only 3% of respondents in Croatia report a general dislike for pets, one of the lowest percentages globally. This low rate highlights a predominantly positive attitude towards animals across the country.
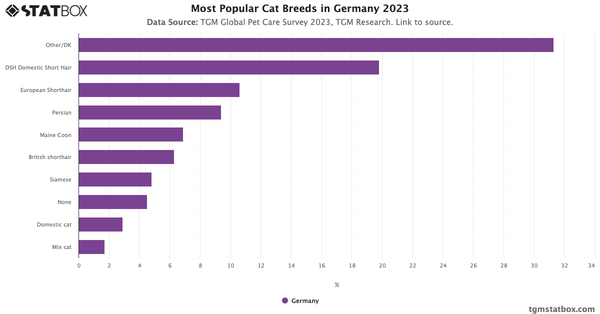
For a deeper dive into the topic, explore most popular pet food brands in Croatia, key factors in choosing pet food in Croatia, most popular cat breeds in Croatia.

Pet Care Report in Croatia 2023
Discover insights into Pet Care in Croatia with TGM StatBox. Access our detailed report, including graphs and tables, to uncover the industry's trends.
Go to report


Connect with our expert team for immediate assistance or comprehensive market analysis. We are always ready to support your business needs.