Conditional Pet Affinity Versus Unconditional Acceptance Across Asia Pacific
Attitudes toward pets carry significant weight in consumer markets, influencing household spending, lifestyle choices, and the types of products and services people seek. Across Asia Pacific, where pet ownership intersects with diverse cultural norms and living conditions, understanding how people relate to animals is central to any meaningful assessment of the pet economy.
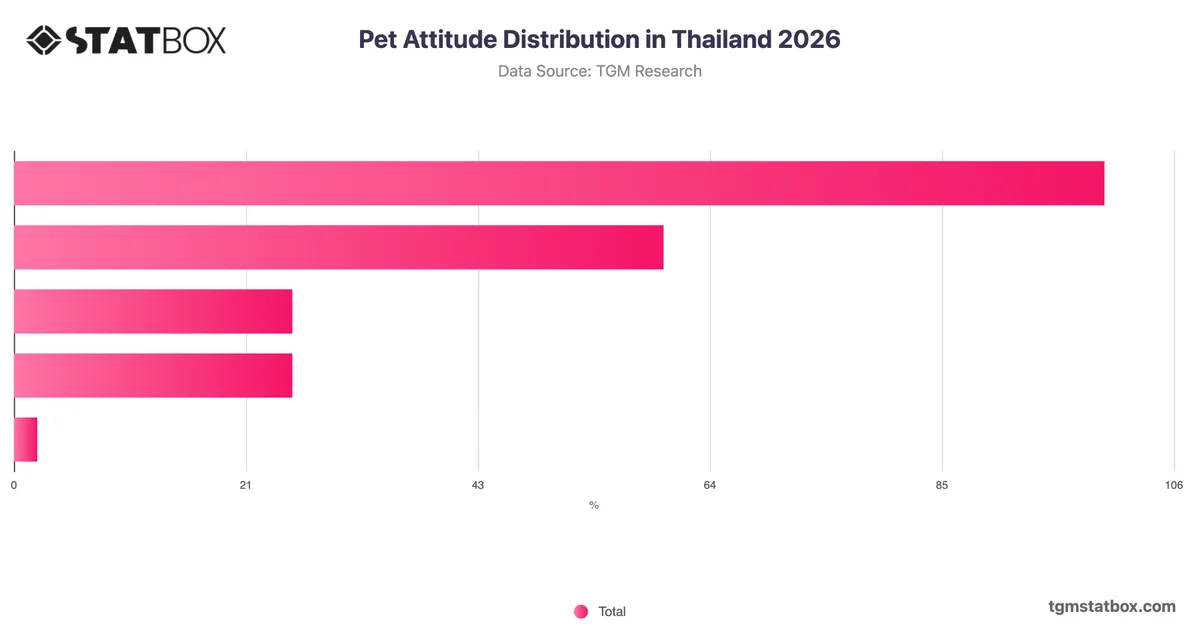
The most analytically significant pattern across Asia Pacific is the dominance of conditional rather than unconditional affinity. While 27% of respondents express love for all types of pets, a substantially larger share, 44%, like only certain types. This gap of 17 percentage points indicates that broad pet positivity should not be conflated with universal openness to all animals. Combined, those with some form of positive orientation account for just over seven in ten adults, yet the majority of that group applies clear distinctions between species or types. Negative or indifferent attitudes remain a secondary but non-trivial presence, with 16% neutral and 10% actively disinclined. For organisations developing pet-related products or communications, this pattern suggests that species-specific or type-specific segmentation is likely to outperform broad pet-owner messaging in both relevance and engagement.