Latent Pet Affinity Versus Ownership Barriers Across Asia Pacific
Attitudes toward pet ownership sit at the intersection of lifestyle aspiration, practical constraint, and personal preference. Across Asia Pacific, the relationship between consumers and pets is shaped by a complex mix of housing conditions, household economics, cultural norms, and individual circumstance, making pet affinity a multidimensional construct rather than a simple binary of ownership or disinterest.
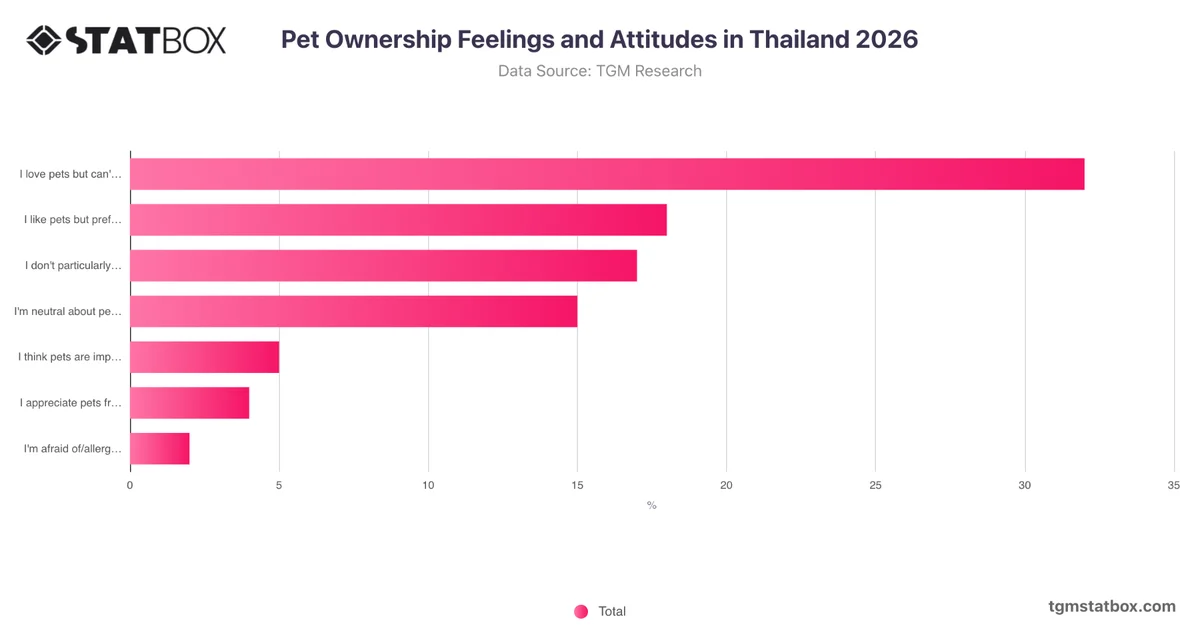
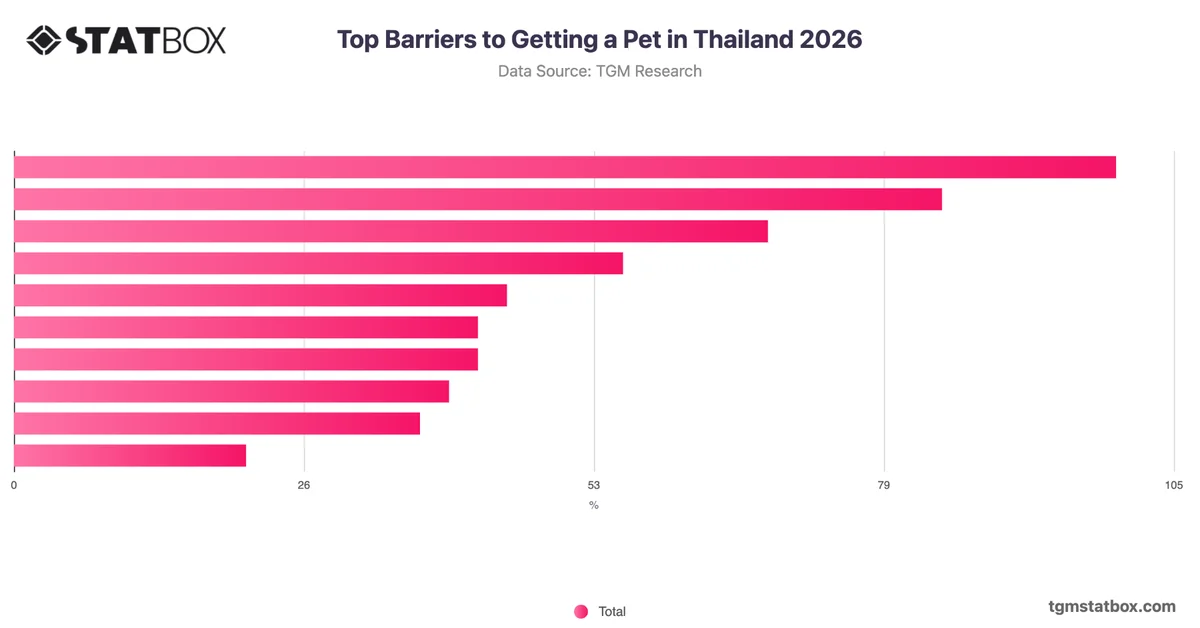
The most analytically significant pattern across Asia Pacific is the gap between affection for pets and the ability or willingness to own one. Nearly a third of respondents express genuine love for pets yet cite current barriers to ownership, while only 19% prefer not to own one despite liking pets. Combined, these two groups account for over half of all responses, pointing to a market where positive sentiment is broadly distributed but constrained by circumstance rather than indifference. Negative or fearful attitudes remain limited, with dislike and allergy combined reaching just 15%. This suggests that the primary challenge for pet-related categories is not persuasion but accessibility. Organisations in pet products, services, or housing should prioritise understanding the specific barriers preventing ownership among affinity-positive consumers, as addressing practical constraints may be more commercially productive than targeting attitudinal conversion.