Latent Pet Affinity Versus Actual Ownership Readiness in Indonesia
Pet ownership sits at the intersection of lifestyle aspiration, household circumstance, and personal preference. In Indonesia, attitudes toward pets are shaped by a range of practical and personal considerations, making the relationship between affection for pets and the decision to own one more complex than simple like or dislike.
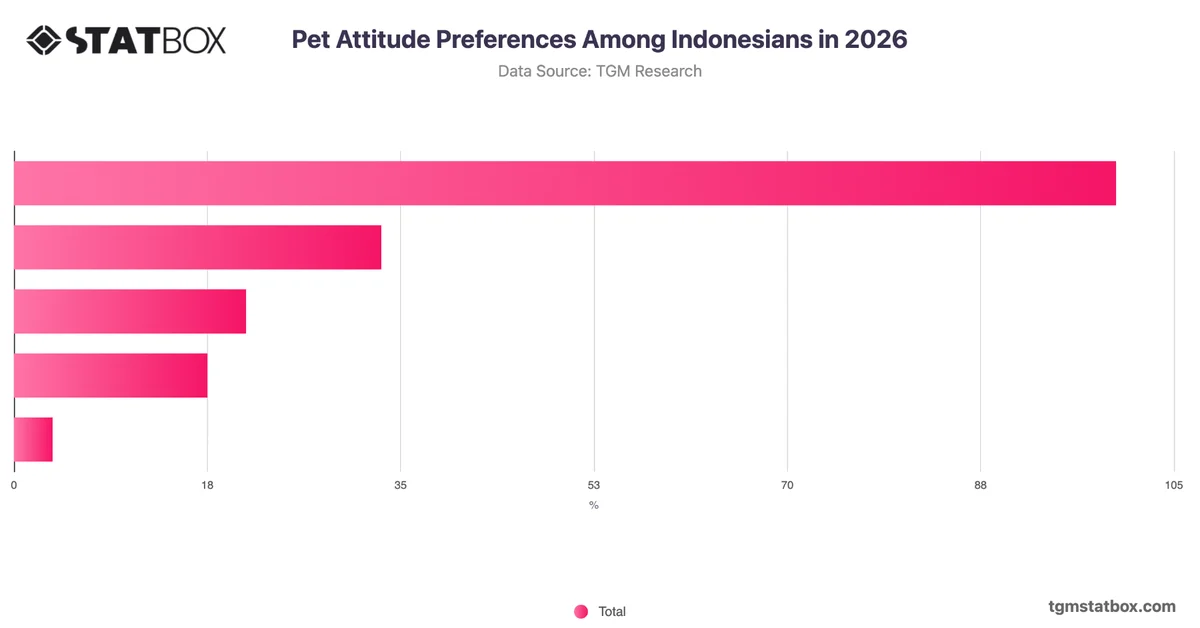
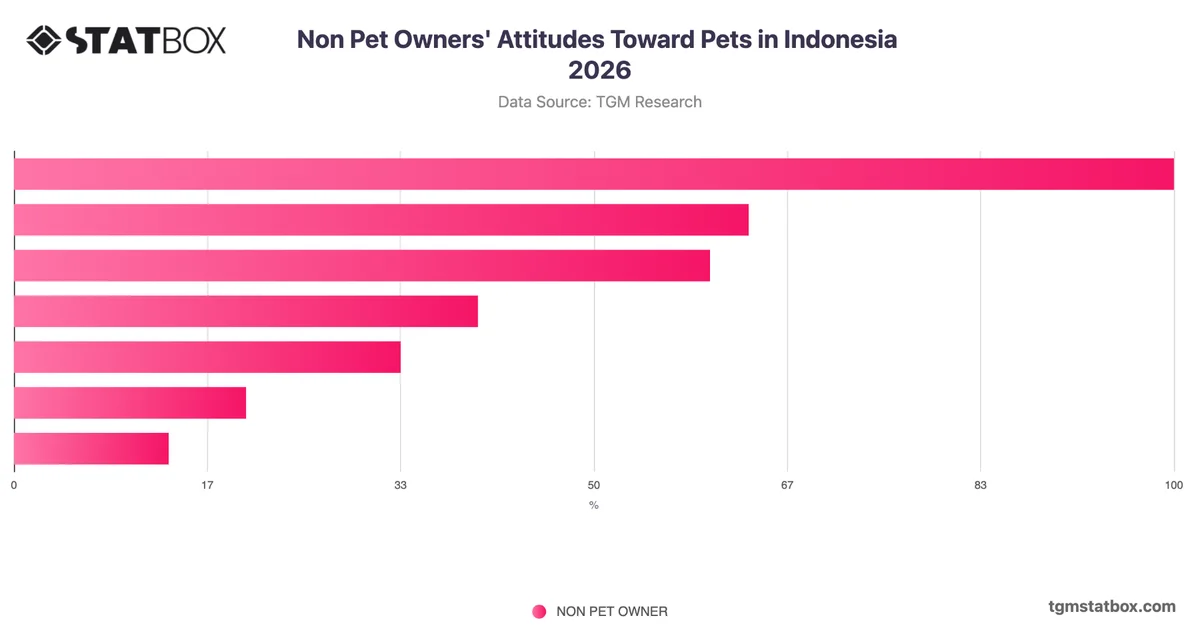
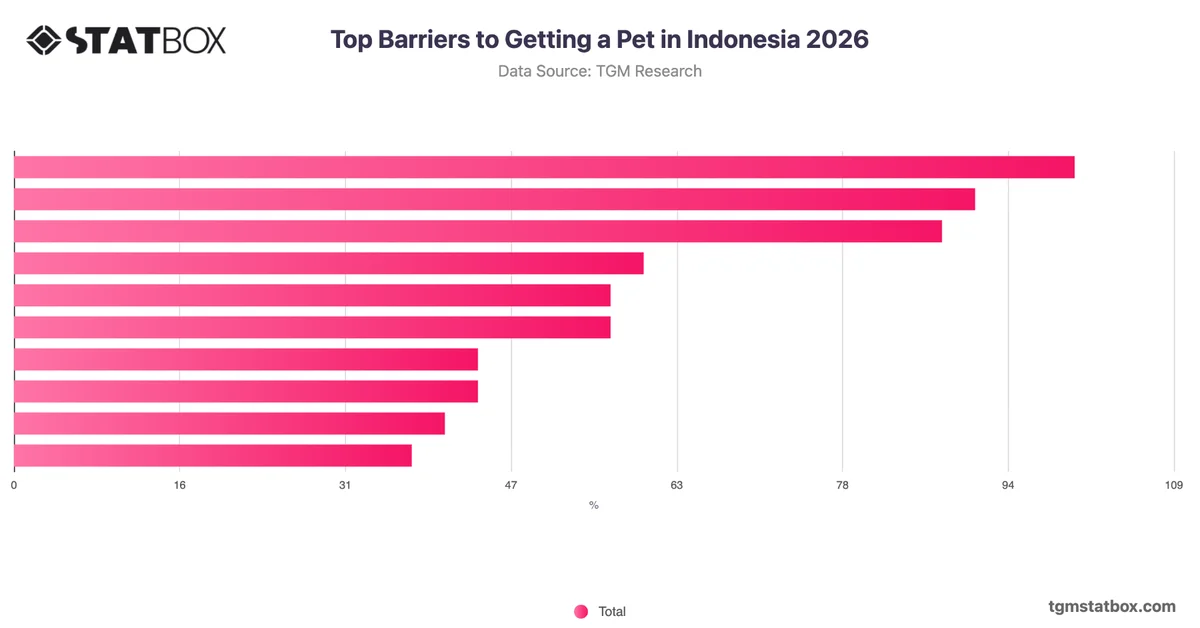
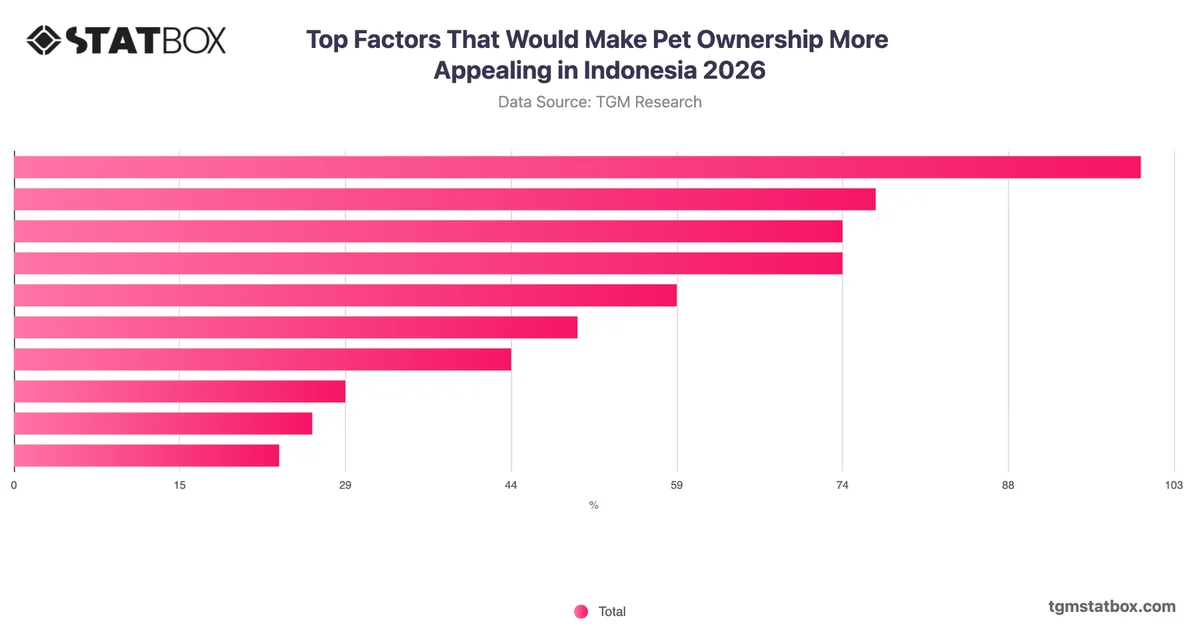
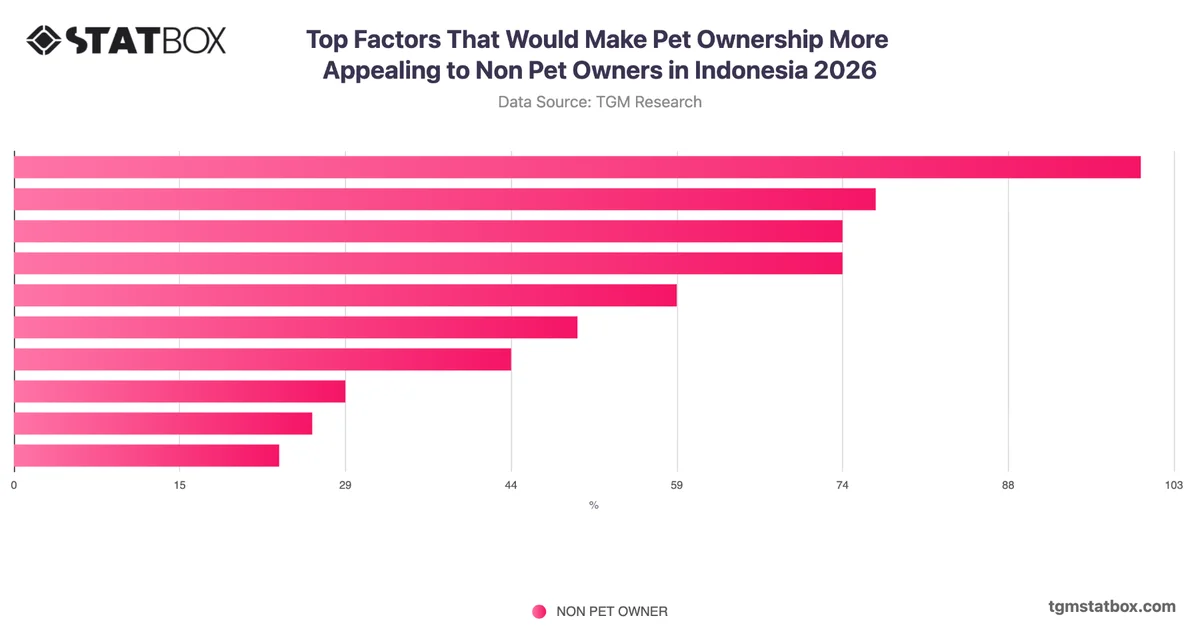
The most analytically significant pattern in Indonesian pet ownership attitudes is the gap between affinity and ownership readiness. Three in ten respondents express genuine love for pets yet cite current constraints preventing ownership, making this the single largest group. Combined with the 19% who like pets but choose not to own one, a substantial majority hold positive or neutral feelings toward pets without translating that sentiment into active ownership intent. Indifference and aversion together account for a comparatively smaller share, suggesting that resistance to pets is not the primary barrier in this market. Instead, circumstantial and lifestyle factors appear to be the more prevalent obstacles. For organisations in pet-related categories, this points to a need to investigate and address the specific practical barriers, such as housing, cost, or time constraints, that prevent affectionate non-owners from converting into active pet owners.