Gender Alignment and Divergence in Pet Attitude Profiles
Attitudes toward pet ownership span a broad spectrum, from deep affection to indifference and aversion. In a market as large and diverse as China, understanding how consumers position themselves relative to pets matters for categories ranging from food and retail to housing and lifestyle services. Gender is a foundational segmentation variable that can indicate meaningful differences in emotional orientation and practical engagement with pet-related decisions.
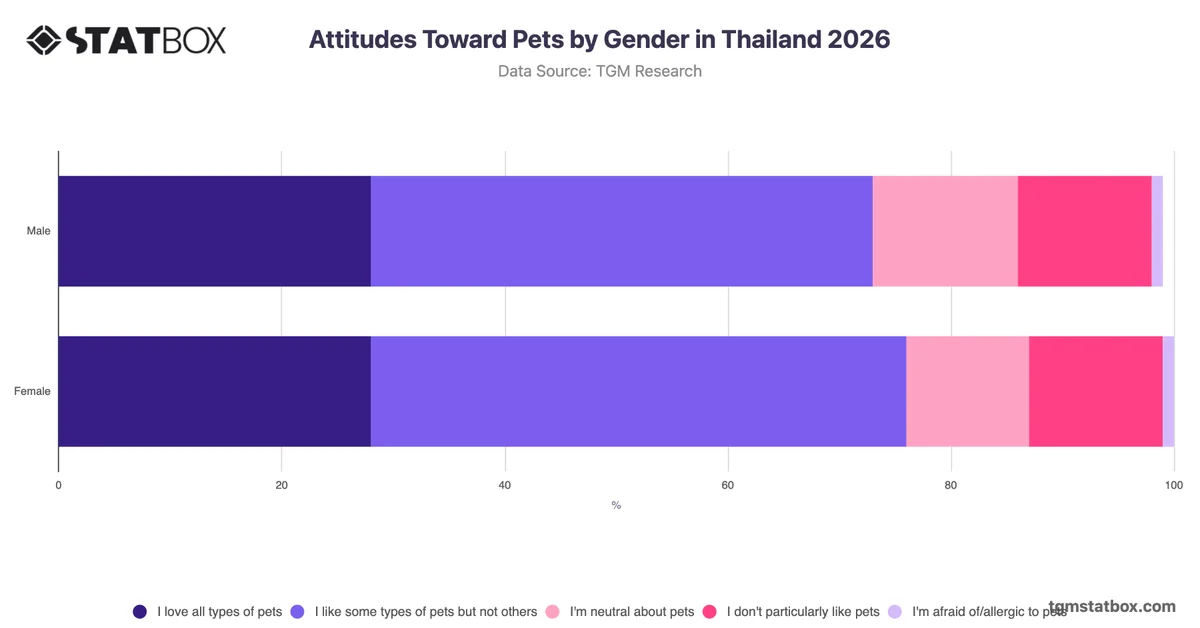
The most notable analytical pattern is one of broad consistency between male and female respondents, punctuated by two meaningful divergences. Across most categories, including those who love pets but cannot currently own one (29% male, 30% female) and those who dislike pets (8% each), gender differences are negligible. However, females are notably more likely to appreciate pets from a distance (17% versus 11%), while males are more likely to report neutrality (22% versus 16%). This suggests that female respondents, though not necessarily more inclined toward ownership, may hold a warmer passive orientation toward animals. For organisations developing non-ownership pet engagement formats, such as pet cafés, community animal programmes, or digital pet content, targeting female audiences with affinity-based rather than ownership-based messaging may better align with the attitudinal profile observed here.