Latent Affinity and Constrained Pet Ownership Attitudes
Consumer attitudes toward pet ownership are rarely uniform. Emotional affinity, practical circumstances, personal preference, and indifference can coexist within the same population, creating a fragmented landscape that resists simple characterisation. Understanding how these attitudes are distributed matters for any organisation operating in or adjacent to the pet care, retail, or related consumer services sectors in China.
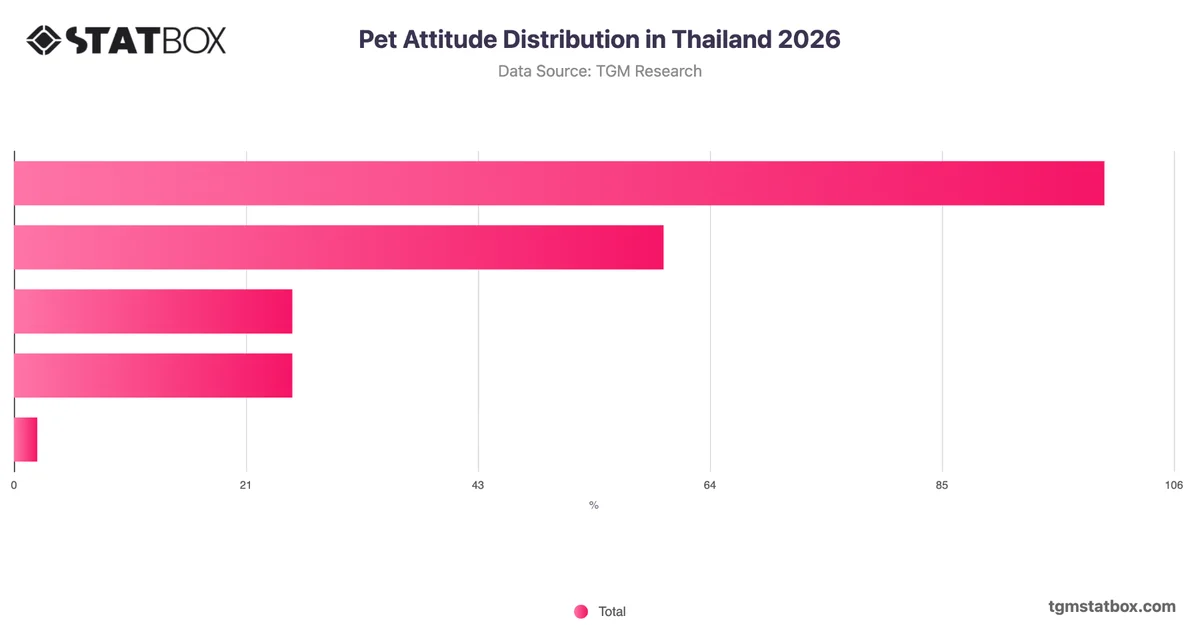
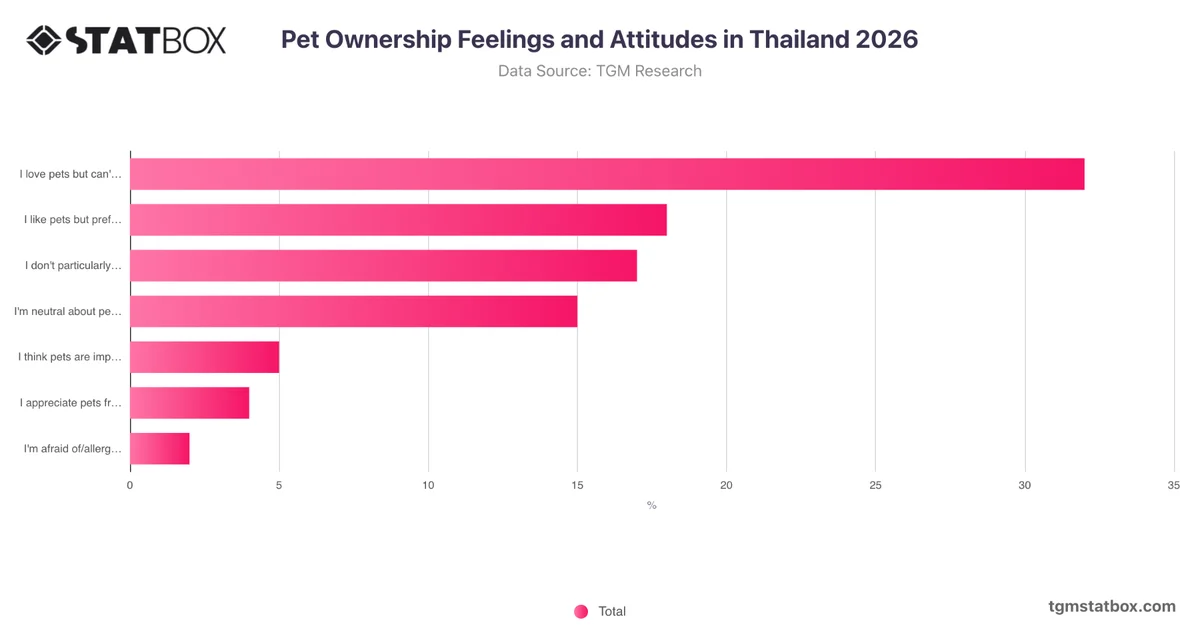
The most analytically significant pattern in Chinese consumer pet attitudes is the gap between affinity and ownership readiness. The largest single group, at 29%, reports loving pets but facing current barriers to ownership, while a further 14% appreciate pets from a distance and 16% express a preference not to own one despite liking them. Together, these three segments account for nearly six in ten respondents and point to a market where positive sentiment toward pets does not translate into ownership intent. Neutrality, at 19%, further reinforces the absence of strong commitment across the population. This distribution suggests that pet category communications targeting broad emotional appeal may be less effective than approaches addressing the specific practical constraints that prevent affinity from converting to ownership. Organisations would benefit from investigating what barriers the largest constrained segment faces, as messaging or product formats that lower those barriers may be more actionable than campaigns aimed at attitude change alone.