Portugal's GDP reflects its post-dictatorship recovery and integration into the European economy. In 1961, GDP was $3.5 billion, growing steadily during the 1960s and 1970s, reaching $17.5 billion in 1974, the year of the Carnation Revolution. Economic stabilization and EU membership in 1986 drove substantial growth, with GDP nearly doubling from $38.7 billion in 1986 to $78.7 billion in 1990.
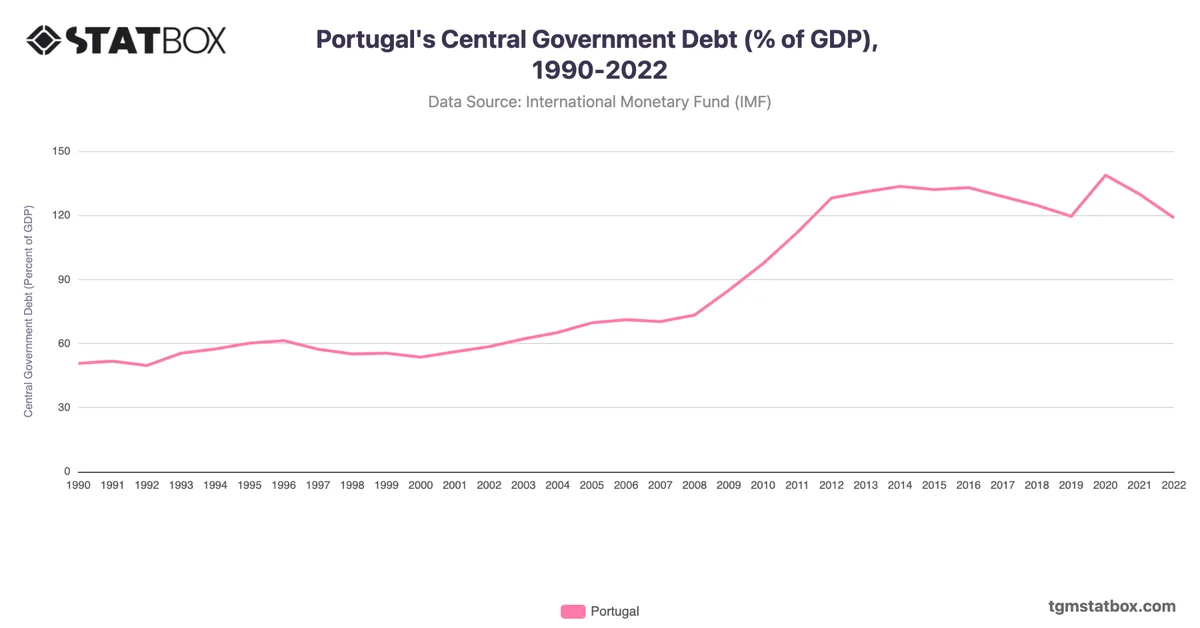
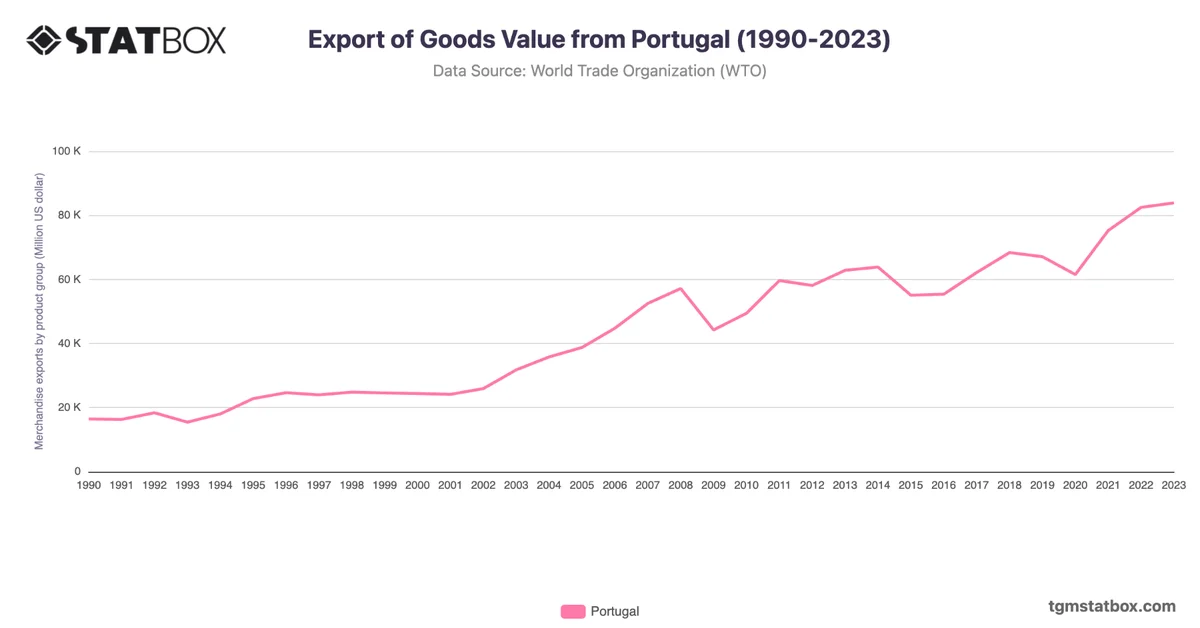
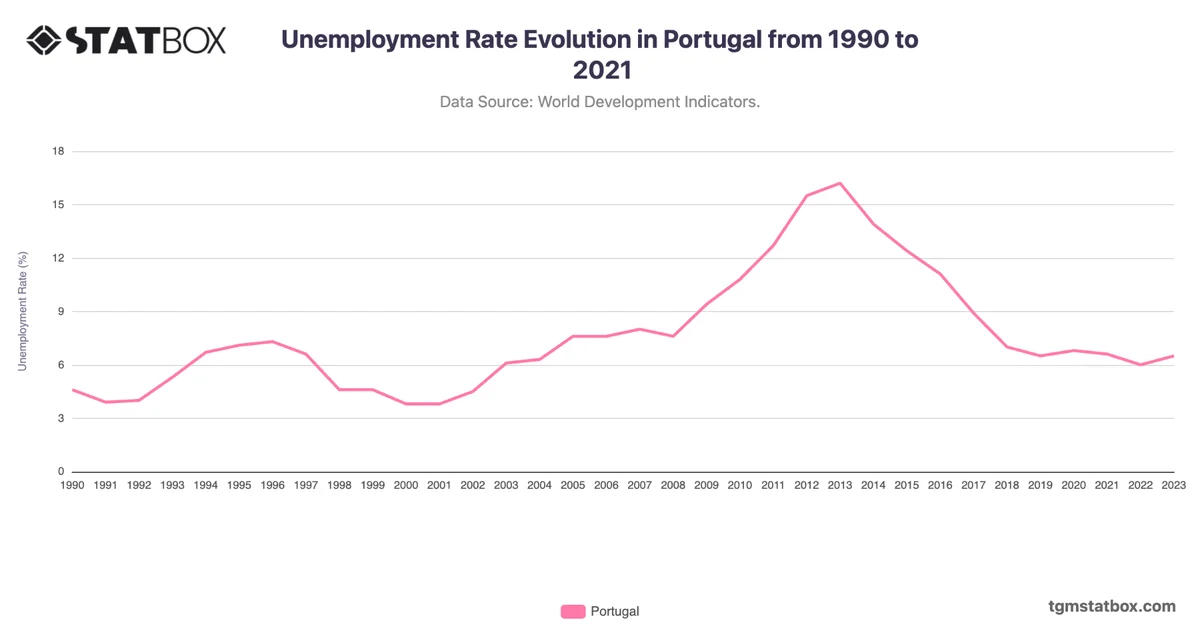
Despite challenges from the 2008 global financial crisis and subsequent European debt crisis, Portugal’s economy rebounded. GDP grew from $229 billion in 2020 to $287 billion in 2023, driven by tourism, renewable energy initiatives, and a robust export sector.
Despite challenges from the 2008 global financial crisis and subsequent European debt crisis, Portugal’s economy rebounded. GDP grew from $229 billion in 2020 to $287 billion in 2023, driven by tourism, renewable energy initiatives, and a robust export sector.
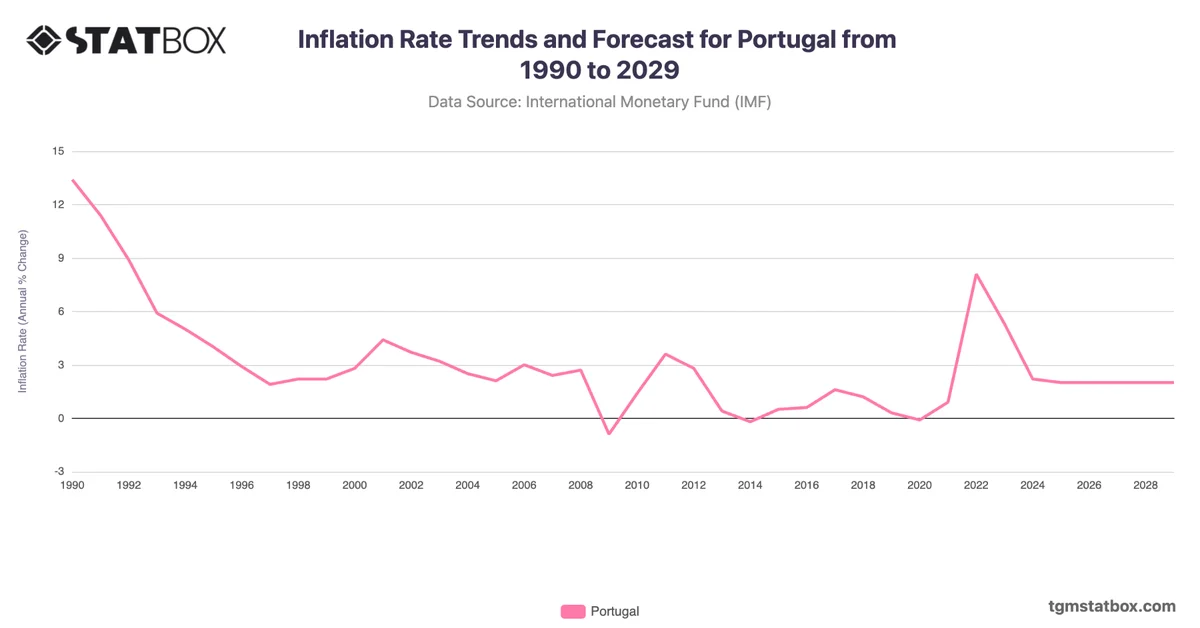
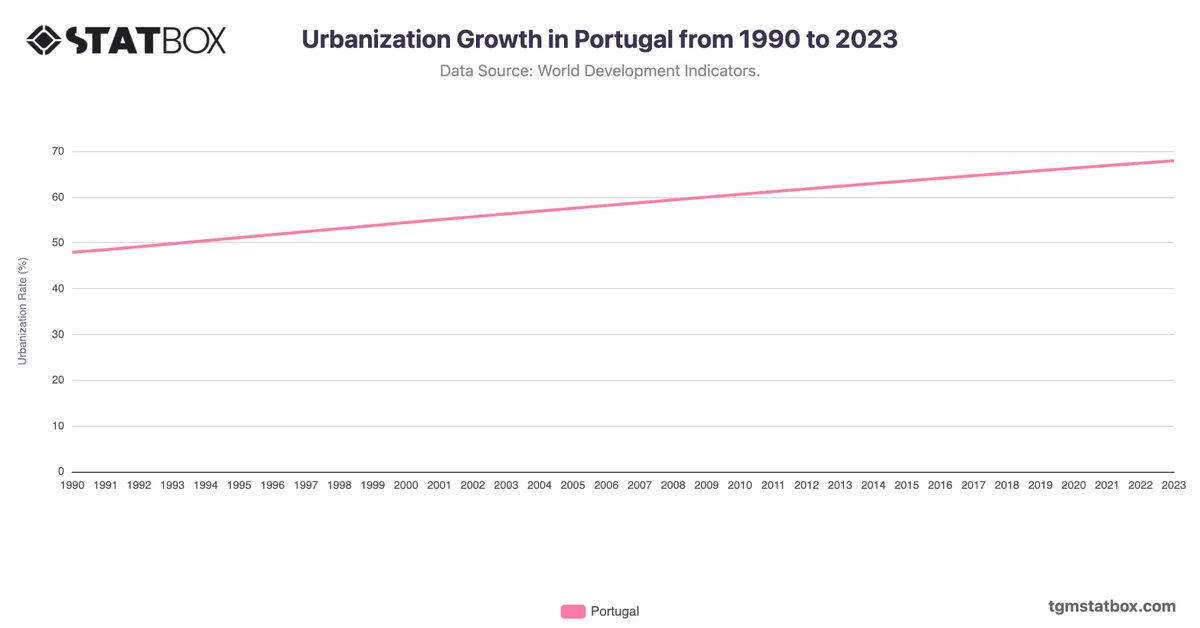
Explore related charts to gain a better understanding of urban expansion in Portugal, Portugal’s inflation rate outlook, Portugal’s goods export value.