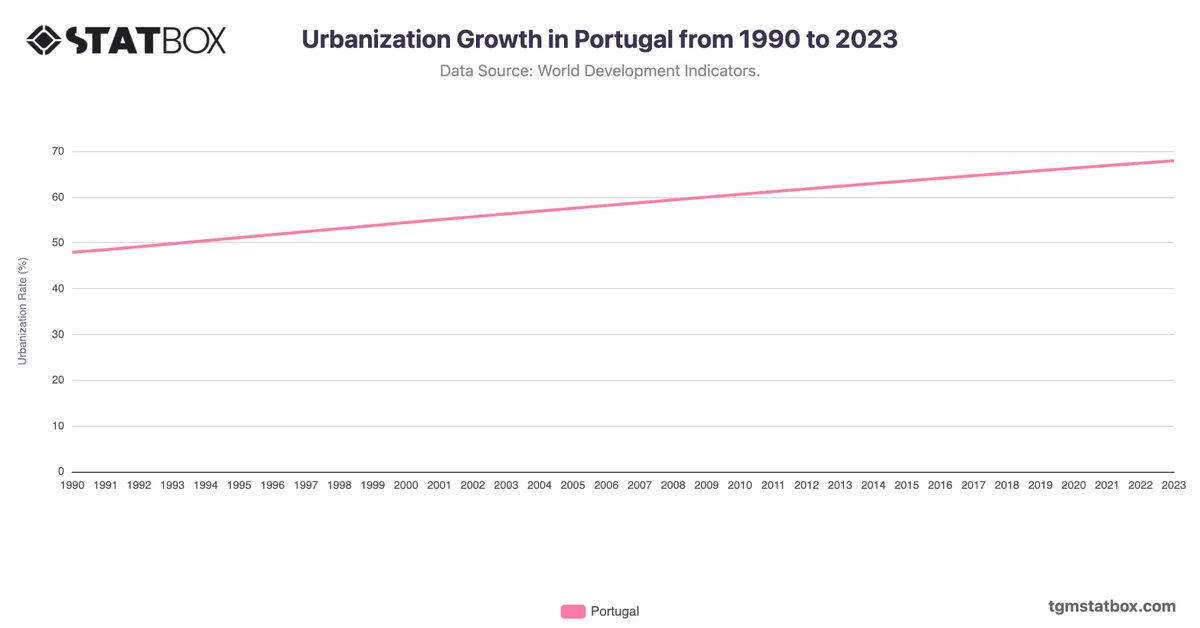
From 1987 to 1990, Portugal saw its military personnel as a percentage of the population decrease gradually from 1.1% to 0.9%, reflecting a broader trend towards demilitarization and professionalization of armed forces within Europe after the Cold War. Urbanization also accelerated in this period, particularly around Lisbon and Porto, influencing a shift in economic priorities and contributing to reduced military recruitment. By 1994, the percentage temporarily rose to 1.2%, possibly linked to renewed focus on NATO contributions, but then resumed a downward trend, dropping to 0.5% by 2000.
Entering the 2000s, Portugal maintained a consistent rate of 0.4% military personnel per capita from 2001 to 2014. This stability can be linked to the country’s shift in focus towards modernization efforts within a smaller force structure, aligning with increased urbanization and investments in non-military sectors. By 2015, the rate declined further to 0.3%, underscoring a broader European pattern of reliance on international coalitions rather than a large standing army. Urban growth during this period continued to outpace rural development, emphasizing economic strategies that moved away from defense spending.
Entering the 2000s, Portugal maintained a consistent rate of 0.4% military personnel per capita from 2001 to 2014. This stability can be linked to the country’s shift in focus towards modernization efforts within a smaller force structure, aligning with increased urbanization and investments in non-military sectors. By 2015, the rate declined further to 0.3%, underscoring a broader European pattern of reliance on international coalitions rather than a large standing army. Urban growth during this period continued to outpace rural development, emphasizing economic strategies that moved away from defense spending.
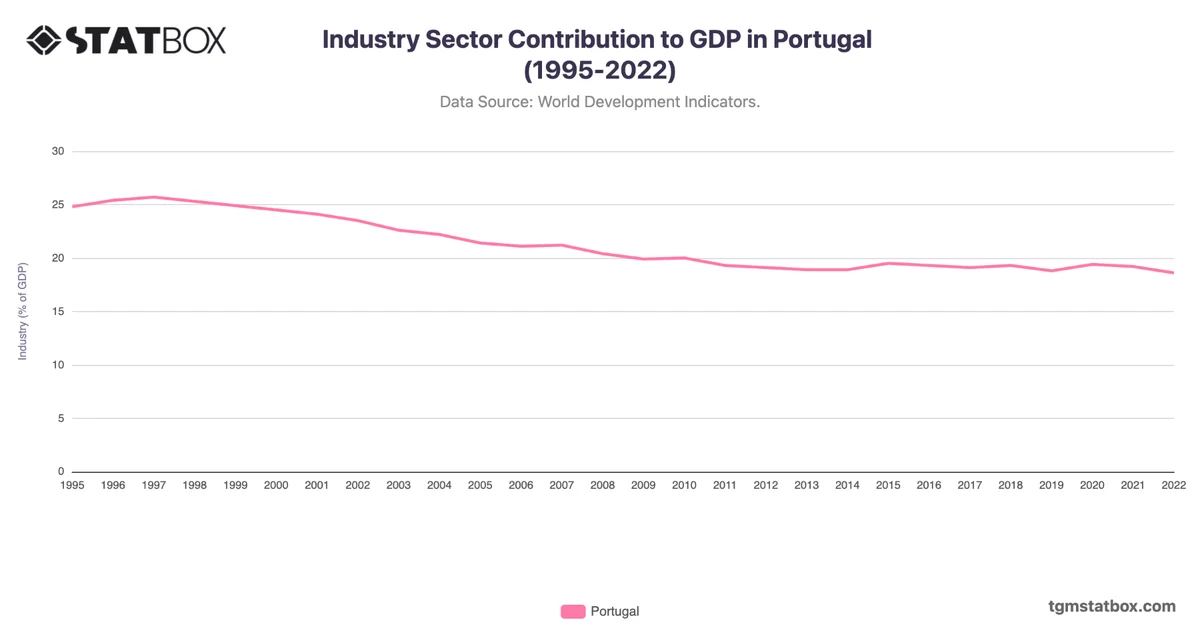
For additional information, visit statistics on Portugal’s manufacturing sector share in GDP, Portugal’s agriculture sector share in GDP, Portugal’s industry sector share in GDP.