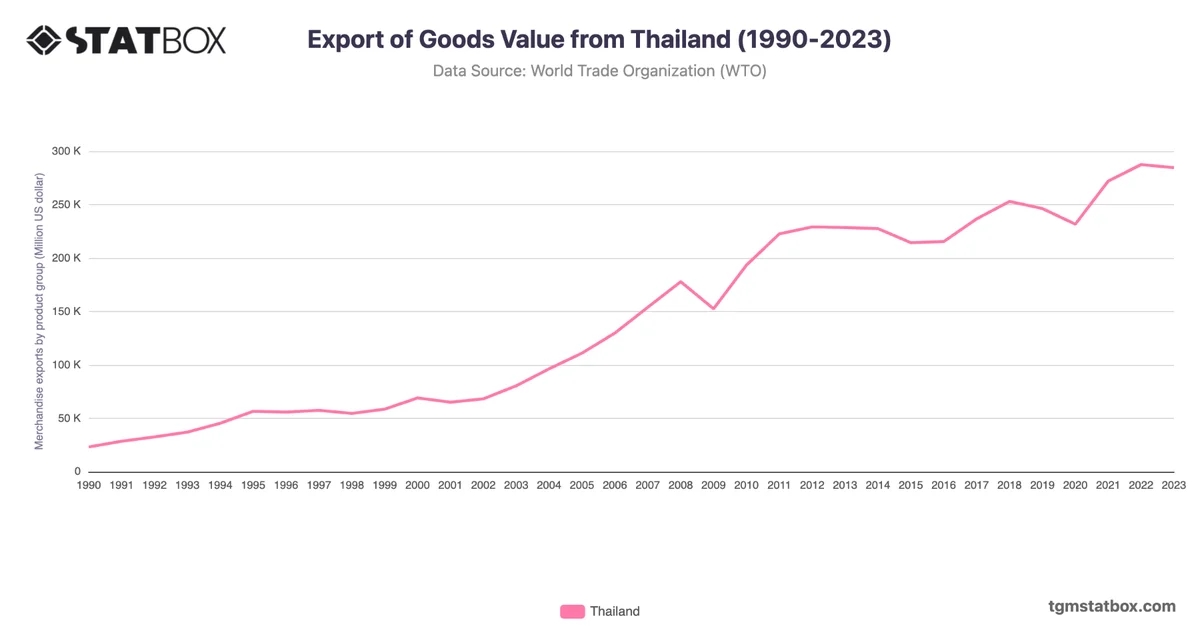
Thailand's imports expanded from $33B in 1990 to $301B in 2022, driven by rapid industrialization and export-oriented growth. Imports surged during the 1990s, reaching $72.3B in 1996, before contracting to $42.9B in 1998 due to the Asian financial crisis.
Post-crisis recovery was robust, with imports climbing to $179.2B in 2008, reflecting strong growth in manufacturing and energy demand. The 2022 peak of $301B reflects Thailand's role as a key global trade player, with increased imports of electronics and industrial goods. Slightly lower imports in 2023 ($289.8B) reflect global economic moderation.
Post-crisis recovery was robust, with imports climbing to $179.2B in 2008, reflecting strong growth in manufacturing and energy demand. The 2022 peak of $301B reflects Thailand's role as a key global trade player, with increased imports of electronics and industrial goods. Slightly lower imports in 2023 ($289.8B) reflect global economic moderation.
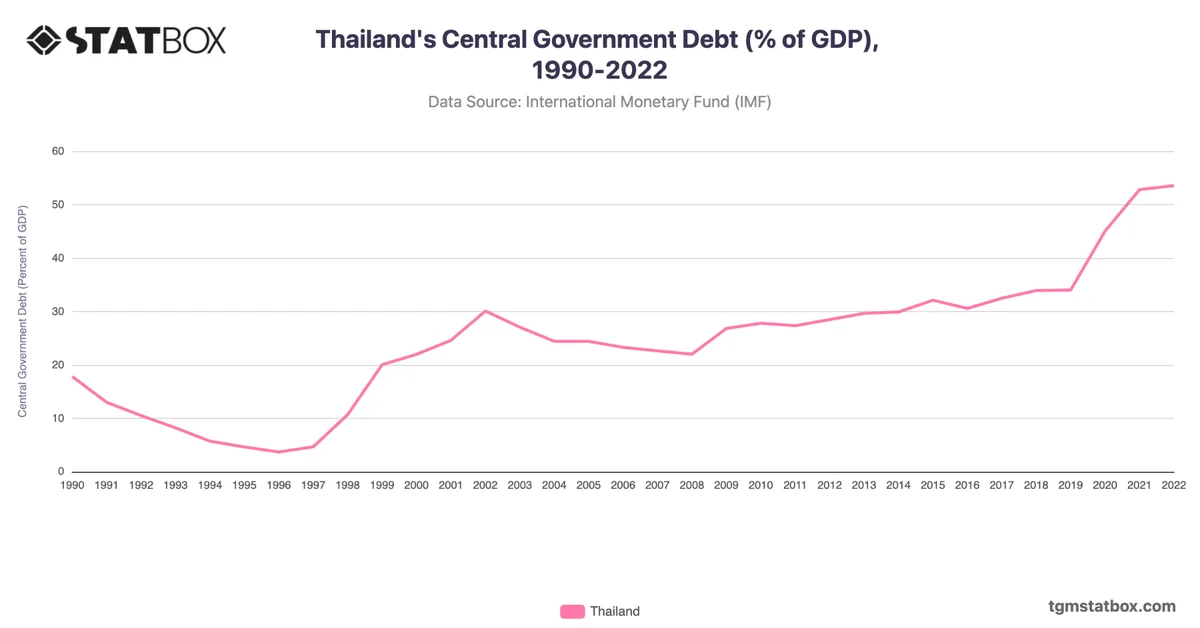
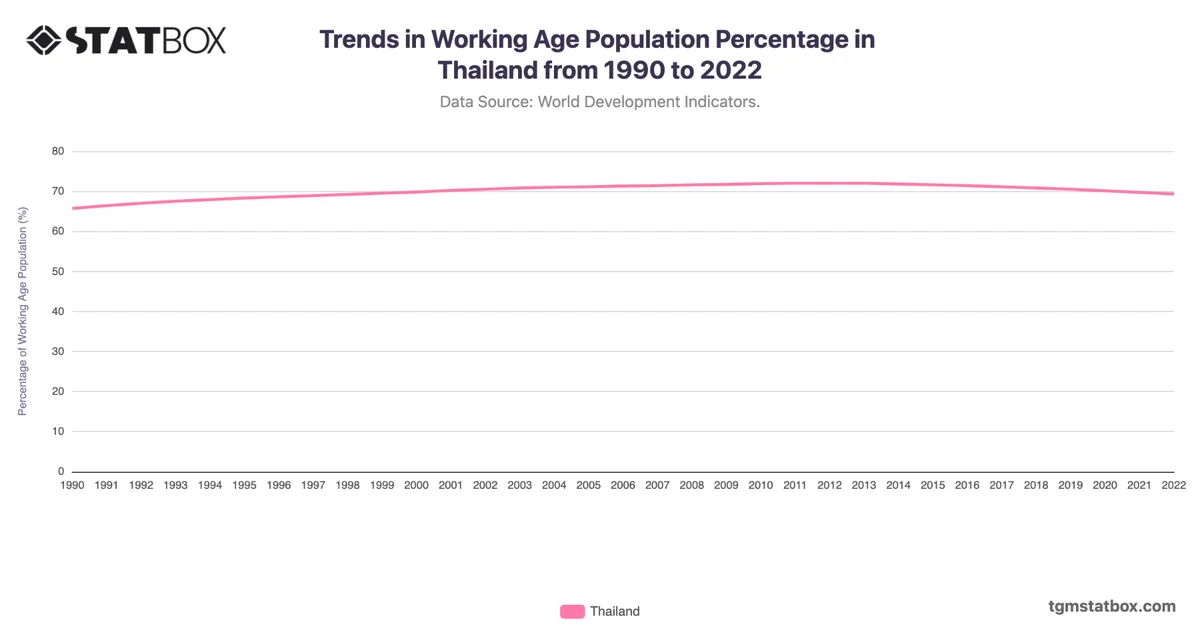
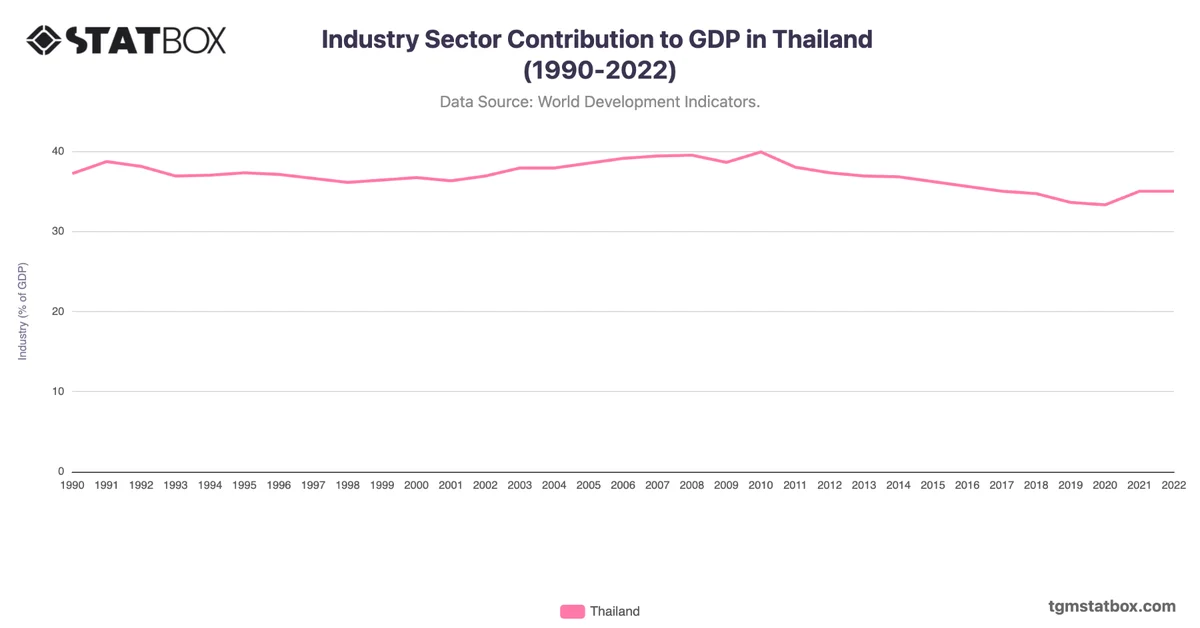
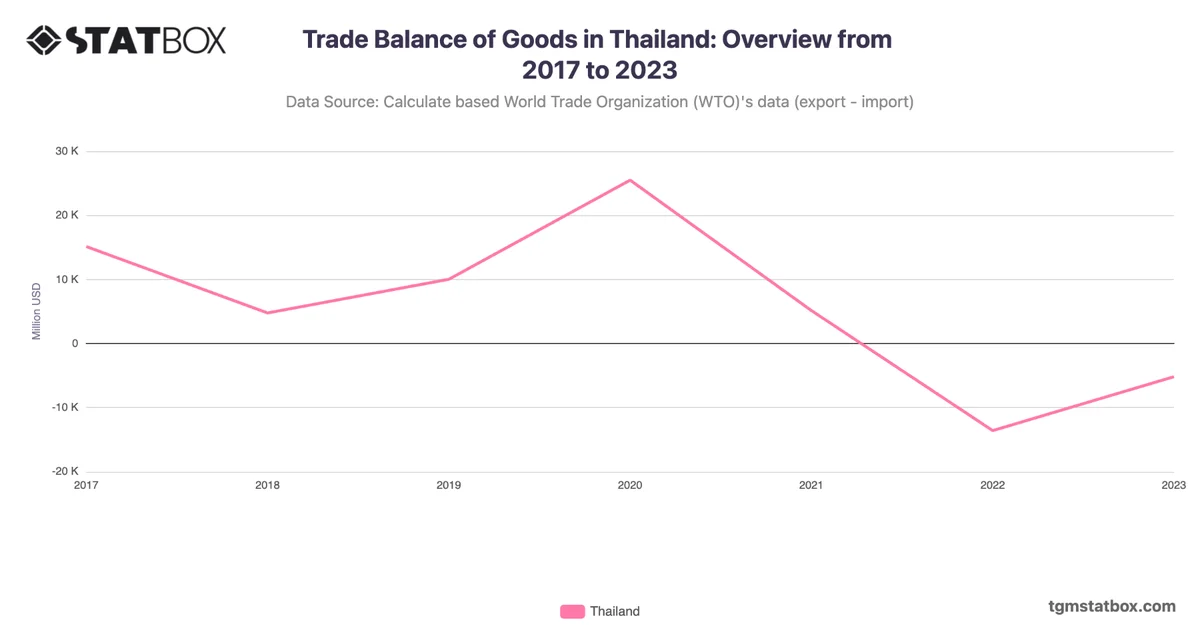
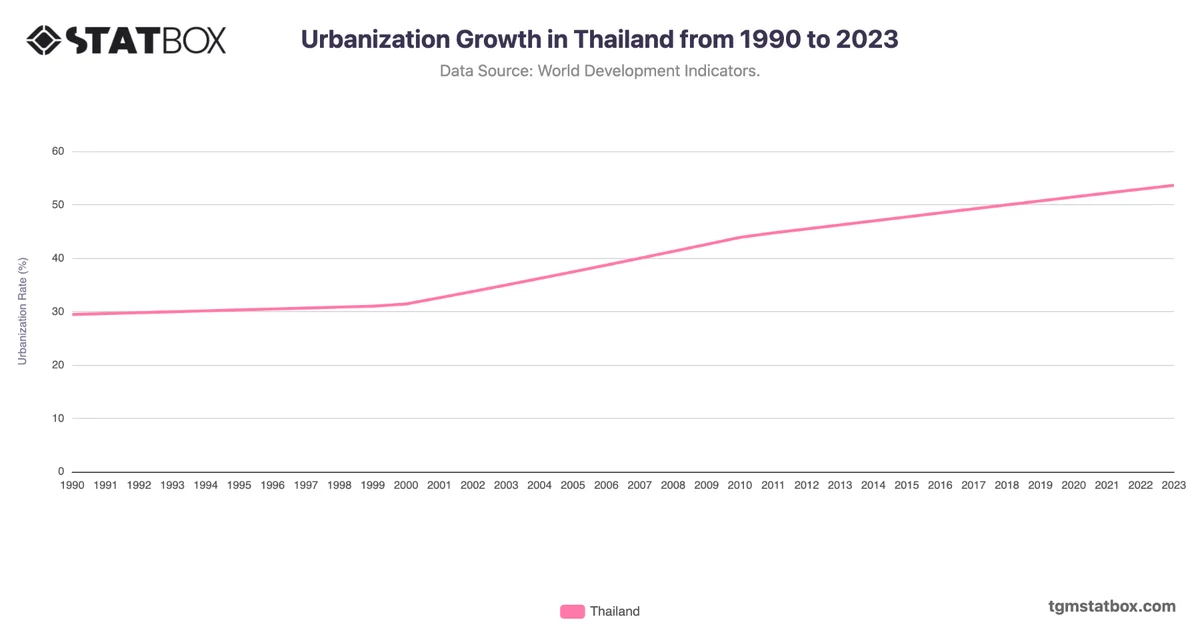
Explore related charts to gain a better understanding of Thailand’s industry sector share, Thailand’s trade balance overview, Thailand’s urbanization rate.