Ukraine’s imports rose from $7.1B in 1992 to $85.5B in 2008, reflecting rapid economic restructuring and trade integration. The global financial crisis caused a steep decline to $45.4B in 2009, followed by recovery to $84.6B in 2012, supported by industrial and agricultural development.
The 2022 decline to $55.2B highlights disruptions due to geopolitical tensions and global trade challenges. The slight rebound to $63.5B in 2023 signals partial recovery. Ukraine’s import trends underscore its reliance on energy and industrial goods amidst fluctuating political and economic conditions.
The 2022 decline to $55.2B highlights disruptions due to geopolitical tensions and global trade challenges. The slight rebound to $63.5B in 2023 signals partial recovery. Ukraine’s import trends underscore its reliance on energy and industrial goods amidst fluctuating political and economic conditions.
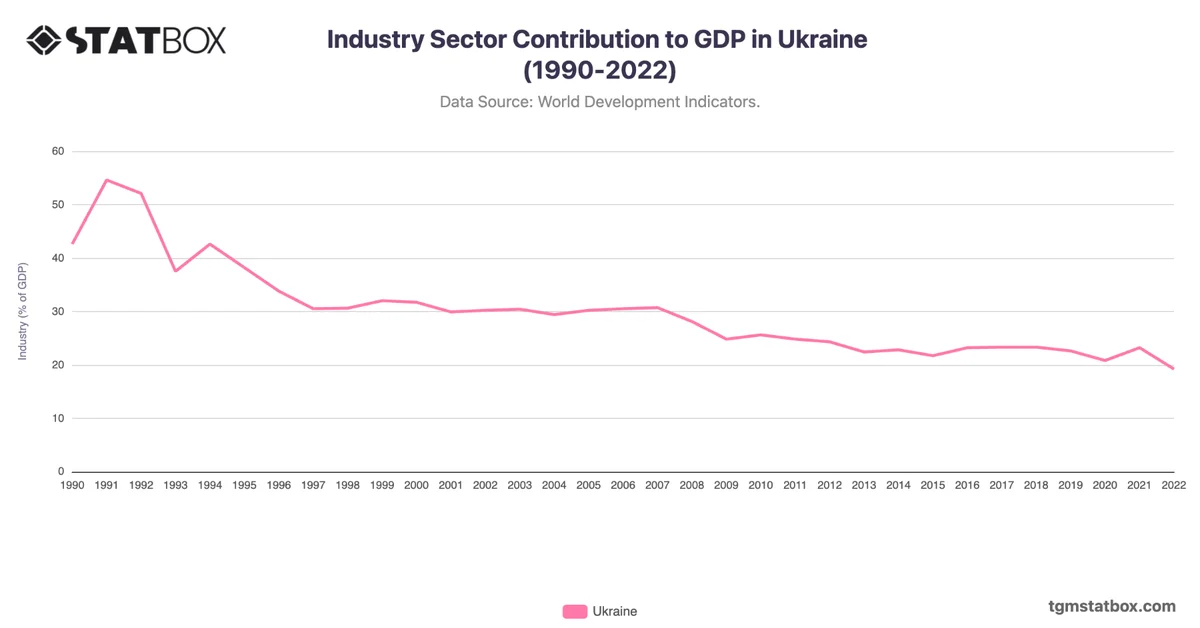
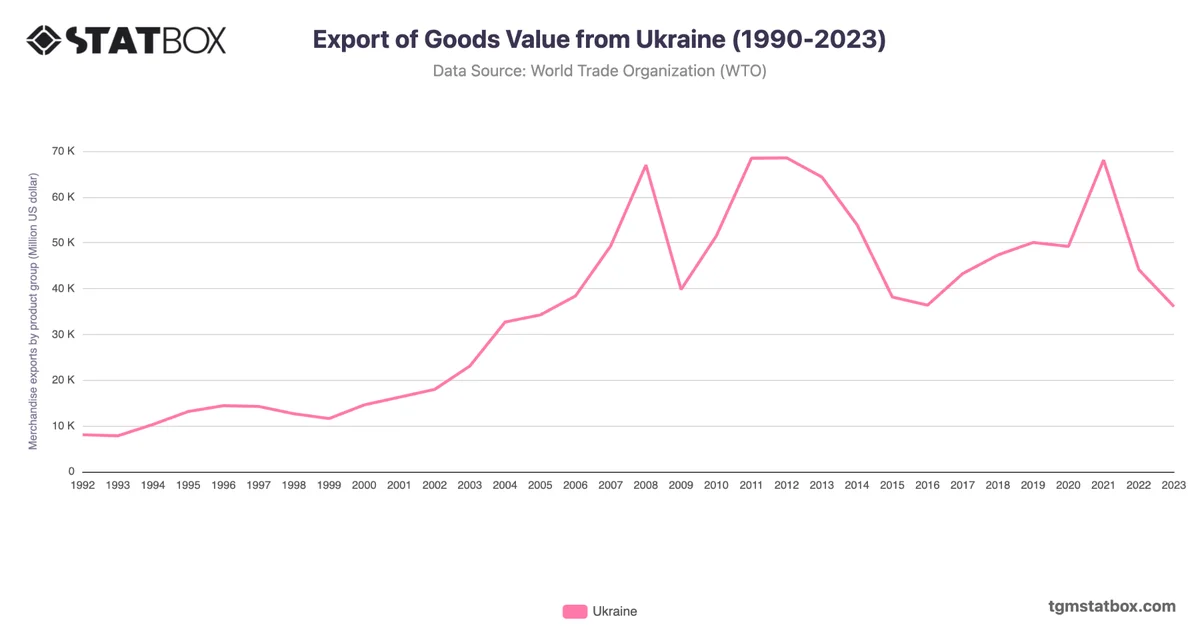
For additional information, visit statistics on Industry sector’s share in Ukraine’s GDP, Ukraine’s export value, Ukraine’s unemployment rate trend.