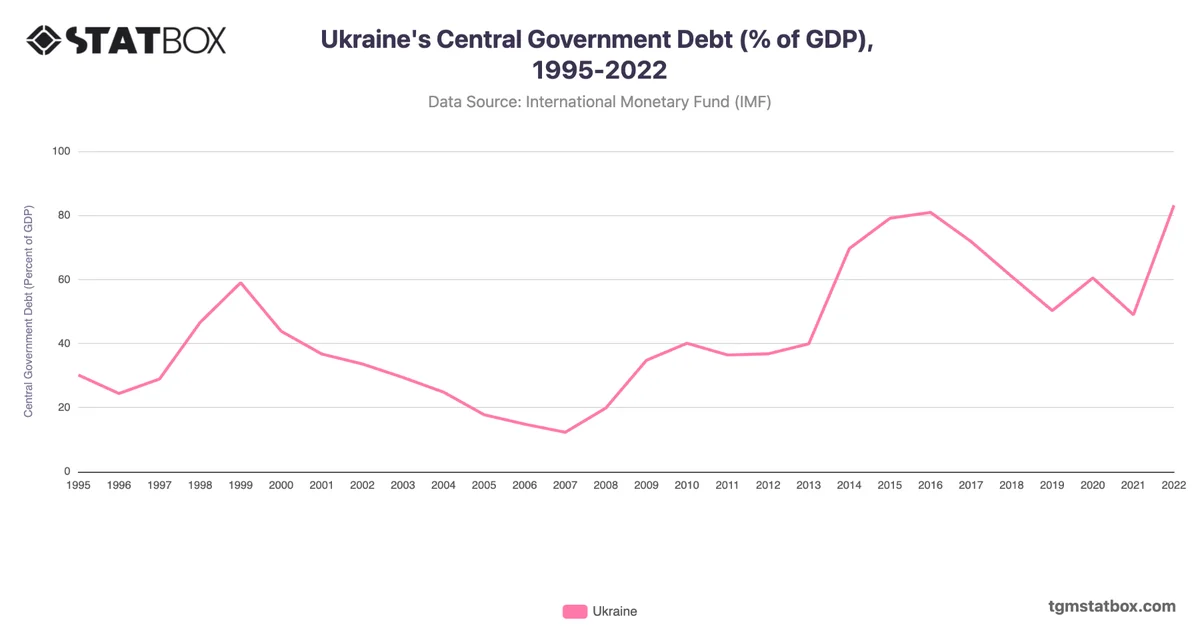
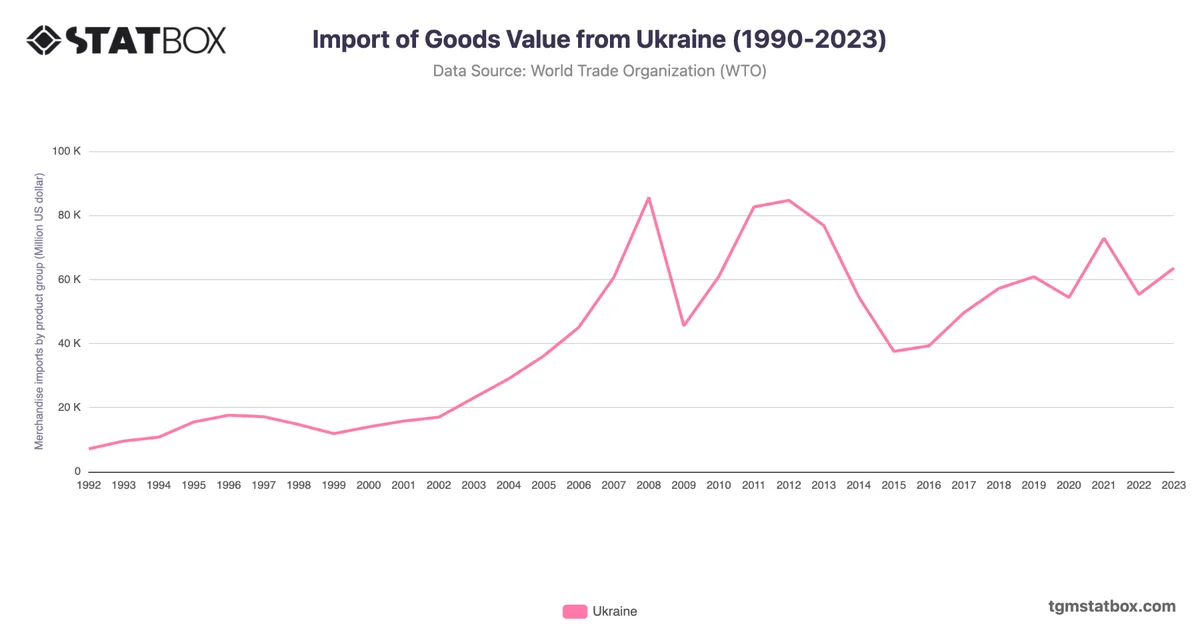
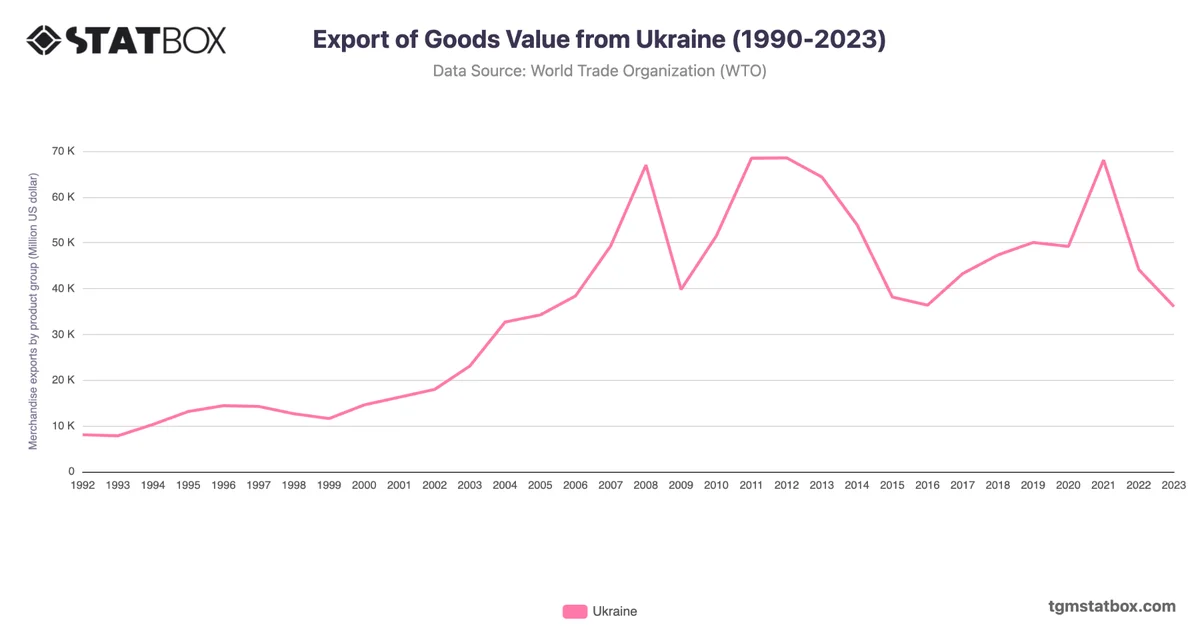
Ukraine’s trade deficit widened significantly over the 2017–2023 period, from -6,344 million USD in 2017 to -27,487 million USD in 2023. The sharp increase in 2023 reflects the severe economic disruptions caused by geopolitical tensions and reduced export volumes, particularly in agriculture and metals, which are critical to Ukraine’s economy.
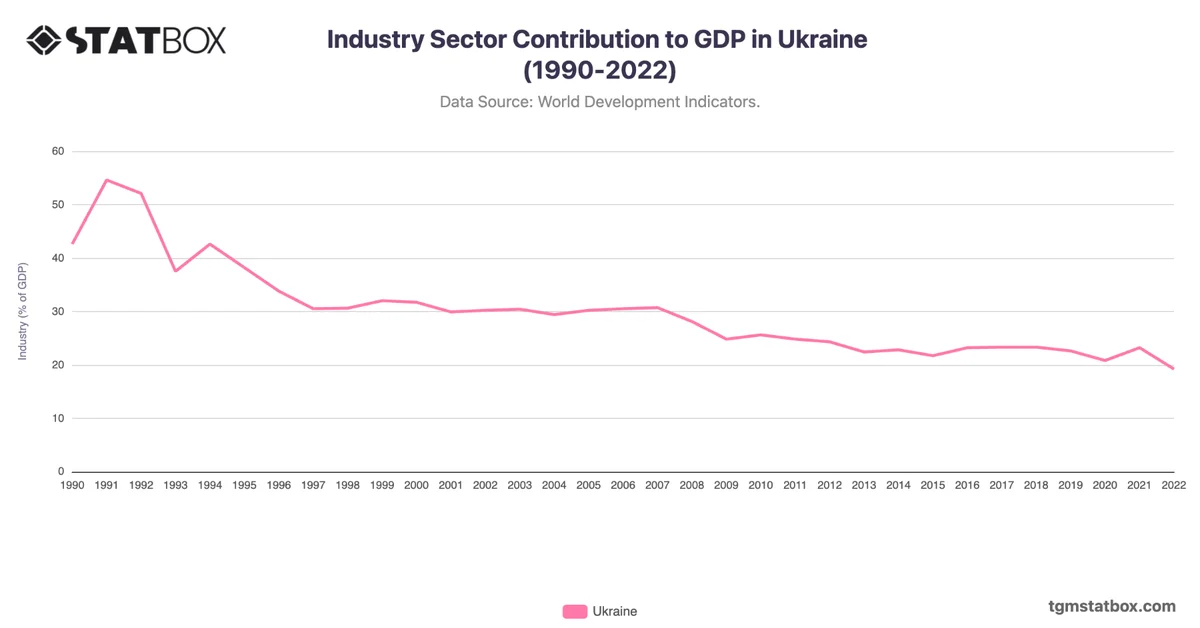
Despite a lower deficit in 2020 and 2021, supported by increased grain exports, the post-2022 period underscores the ongoing challenges of maintaining trade stability amid war-related disruptions, decreased industrial output, and constrained logistics.
Despite a lower deficit in 2020 and 2021, supported by increased grain exports, the post-2022 period underscores the ongoing challenges of maintaining trade stability amid war-related disruptions, decreased industrial output, and constrained logistics.
Find out more through related statistics on Ukraine’s population growth, Ukraine's agriculture’s share in GDP, Ukraine’s population figures.