Share the statistic on social media channels or embed the statistic in your website using "Embed Code", where available.
Share chart
Embed chart Embed copied!Cite this statistic and select one of the following formats: APA, Chicago, Harvard, MLA & Bluebook
Key Takeaways
Vietnam demonstrates a balanced device usage pattern, with 52.92% on mobile and 45.52% on computers. This indicates a growing digital landscape where both platforms are essential for work and education. The 1.56% tablet usage suggests that while computers and mobiles are preferred, tablets remain less common.
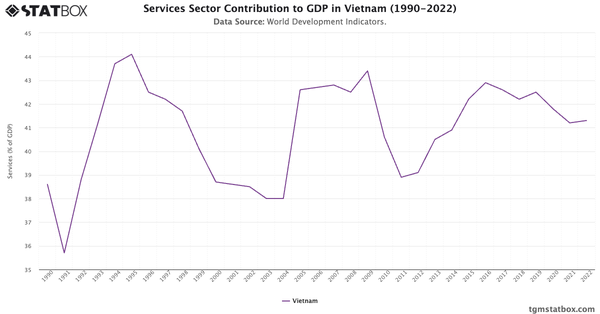
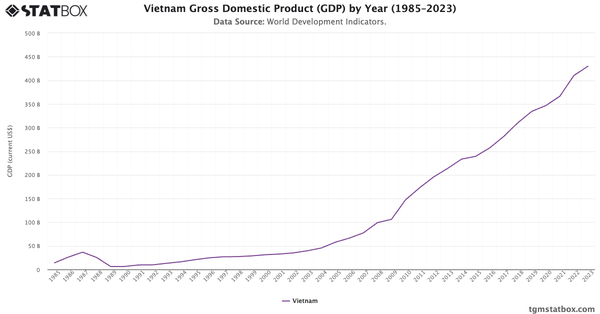
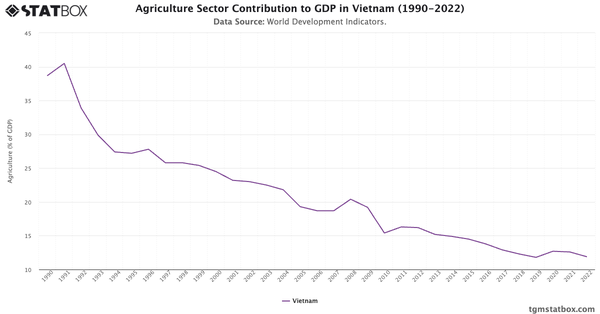
For additional information, visit statistics on Vietnam’s agriculture share in GDP, Vietnam’s manufacturing sector share in GDP, Vietnam’s services sector share in GDP.

Global Sustainability Insights Report 2024
Learn about Global Sustainability with TGM StatBox. Explore our detailed report, complete with graphs and tables, for in-depth insights.
Go to report


Connect with our expert team for immediate assistance or comprehensive market analysis. We are always ready to support your business needs.