Viet Nam's export value has experienced a dramatic increase since the 1990s, reflecting the country’s economic transformation and integration into the global economy. From a modest $2.4 billion in 1990, exports grew steadily throughout the 1990s, with a significant jump in the early 2000s, reaching $14.5 billion in 2000. The country’s entry into the World Trade Organization in 2007 further accelerated export growth, with key industries such as textiles, electronics, and agricultural products driving the increase. By 2010, exports had surged to $72.2 billion, and by 2015, they reached $162 billion.
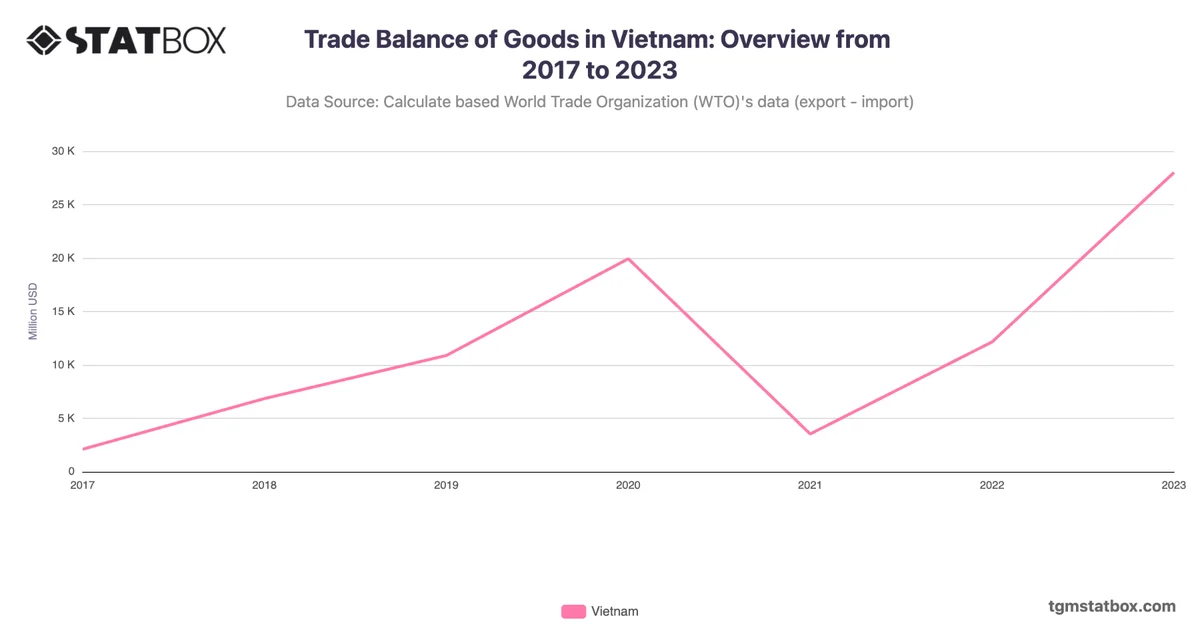
The period from 2015 to 2023 saw Viet Nam’s exports continue to climb, peaking at $371 billion in 2022, despite the disruptions caused by the global pandemic. Factors contributing to this growth included the expansion of manufacturing capabilities, particularly in electronics and machinery, as well as the country’s increasingly important role as a global trade hub. The most recent data from 2023 indicates $353.8 billion, a slight decrease from the previous year, but still a strong performance considering global challenges. Viet Nam’s export sector remains a critical part of its economy, benefiting from its competitive labor costs and export-focused industrial policies.
The period from 2015 to 2023 saw Viet Nam’s exports continue to climb, peaking at $371 billion in 2022, despite the disruptions caused by the global pandemic. Factors contributing to this growth included the expansion of manufacturing capabilities, particularly in electronics and machinery, as well as the country’s increasingly important role as a global trade hub. The most recent data from 2023 indicates $353.8 billion, a slight decrease from the previous year, but still a strong performance considering global challenges. Viet Nam’s export sector remains a critical part of its economy, benefiting from its competitive labor costs and export-focused industrial policies.
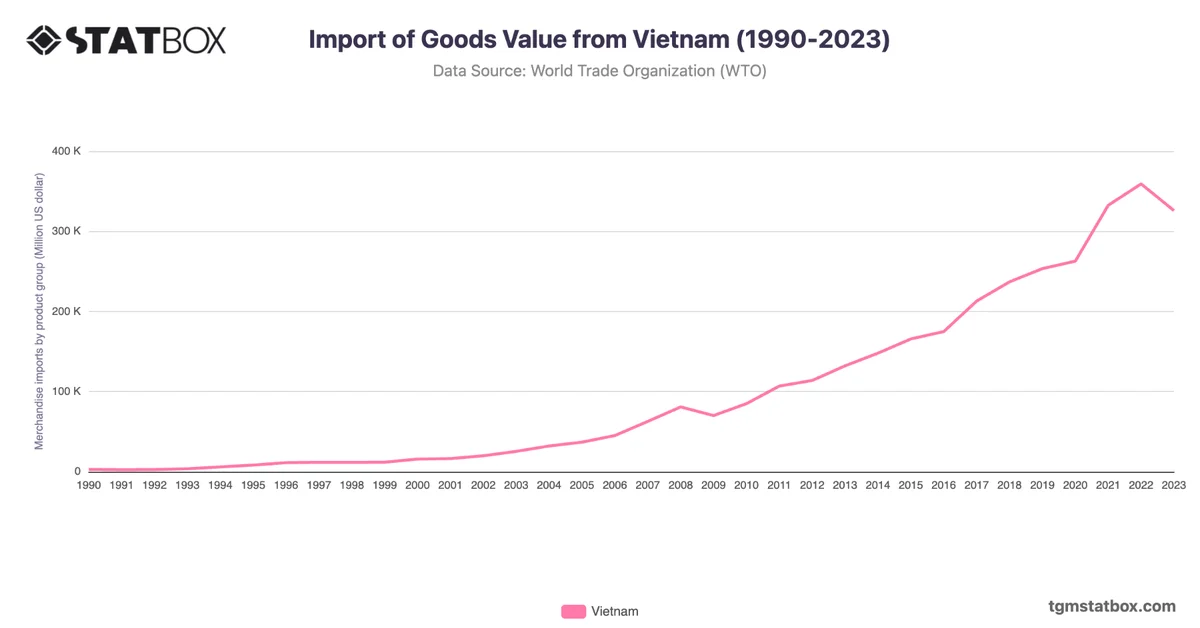
Discover additional trends and data on Vietnam’s services sector share in GDP, Vietnam’s fertility rate trends, Vietnam’s import value.