Chart

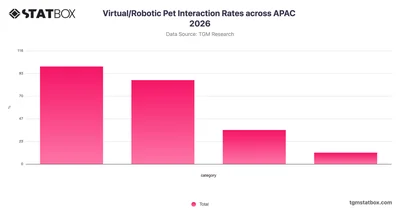
Virtual/Robotic Pet Interaction Rates across APAC 2026

Log in to unlock

No account? Sign up free — new members get 3 premium charts to view.

Insights

Key Takeaways

Latent Demand Versus Actual Adoption of Virtual and Robotic Pets

Virtual and robotic pets occupy a distinct space within consumer technology, blending companionship, entertainment, and innovation. As these products become more technically sophisticated, understanding where consumer attitudes sit on the spectrum from curiosity to committed ownership becomes increasingly relevant for product developers, retailers, and platform designers across APAC.

AI-powered chart insight: This summary is automatically generated to help you understand the chart at a glance. It is intended as an overview; view the full chart and underlying data for complete context.

Related report

Would you like to know more?
Check our report on this topic

Charts library

Further Recommended Statistics

Statbox vector
The briefing
New data, in your inbox

Consumer insights, data stories and product updates as we publish them. No other mail, and one click to leave.

Roughly two emails a month.

Research services
Have a question our newsroom hasn't answered? Ask it directly.

Our team can run the study behind the story — in 60+ countries, on your question, with the data belonging to you.