Algeria’s Net ODA (% of GNI) has remained consistently low, peaking at 0.9% in 1998 and declining steadily thereafter. Early 1990s levels were influenced by Algeria’s political unrest during its civil war, which attracted limited but targeted international support. The sharp drop post-2000 reflects Algeria's growing self-sufficiency, fueled by its substantial oil and gas revenues.
From 2010 onwards, Net ODA stabilized around 0.1%, signaling Algeria’s reduced dependency on foreign aid. The consistent low levels underscore the country's ability to finance its development, despite challenges related to economic diversification.
From 2010 onwards, Net ODA stabilized around 0.1%, signaling Algeria’s reduced dependency on foreign aid. The consistent low levels underscore the country's ability to finance its development, despite challenges related to economic diversification.
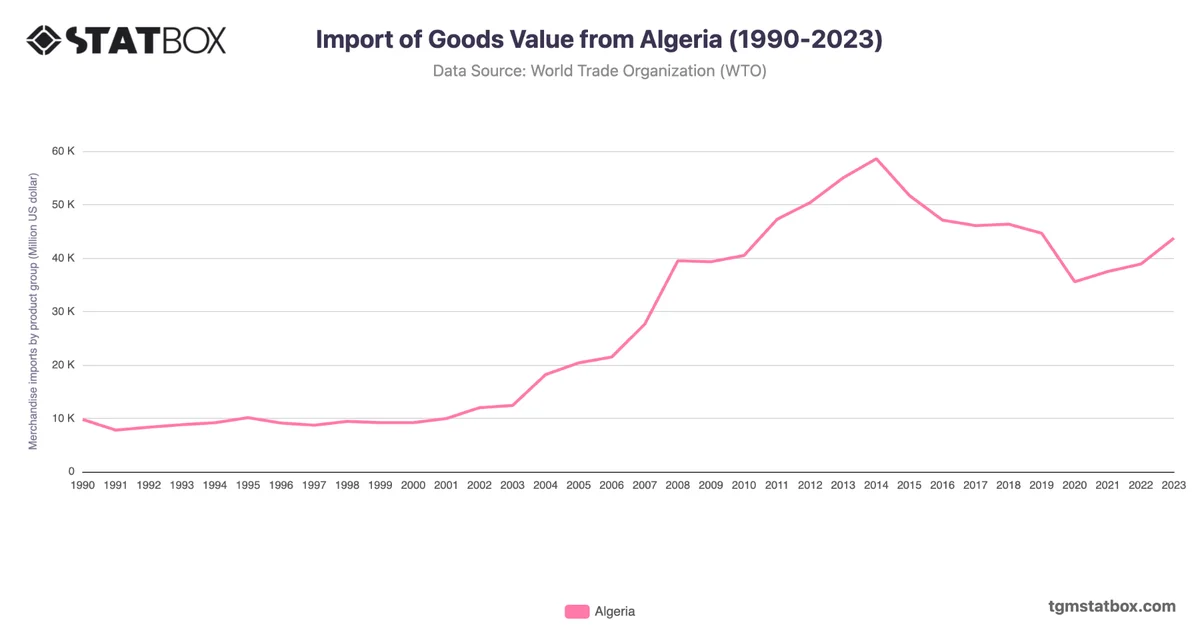
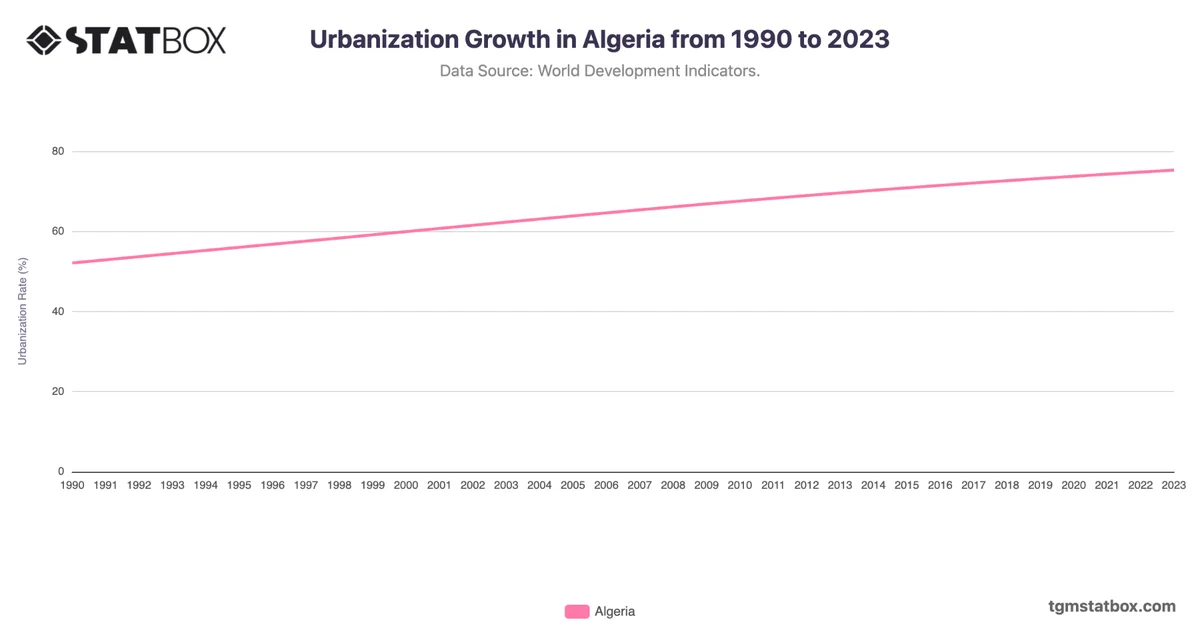
For a broader context, visit other statistics on Algeria’s urbanization rate, Algeria’s manufacturing sector share in GDP, Algeria’s goods import value.