Share the statistic on social media channels or embed the statistic in your website using "Embed Code", where available.
Share chart
Embed chart Embed copied!Cite this statistic and select one of the following formats: APA, Chicago, Harvard, MLA & Bluebook
TGM Global Pet Care Survey 2024, TGM Research
"
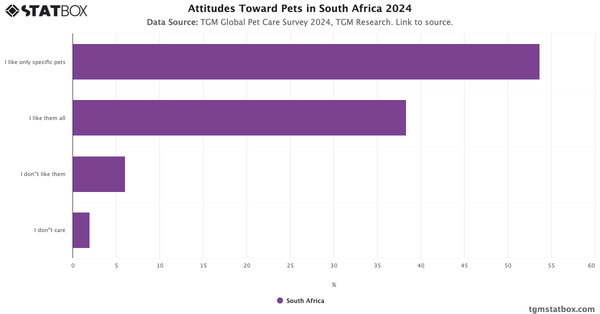
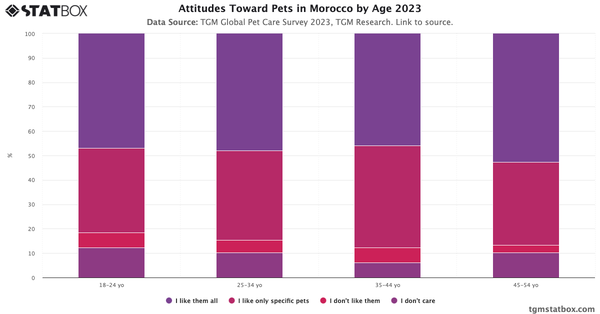
What is your attitude towards pets?
"
Key Takeaways
A majority of respondents express a preference for specific pets rather than all pets. 50.8% of males and 56.6% of females indicate they like only specific pets, with younger age groups (18-24 and 25-34) showing particularly strong preferences at 53.1% and 57.4%, respectively. In comparison, the proportion of individuals who claim to "like them all" is lower, with 40.9% of males and 35.7% of females expressing this sentiment.
Explore related charts to gain a better understanding of most popular pet services in South Africa, most popular cat breeds in South Africa, South African pet ownership attitudes.

Pet Care Report in South Africa 2024
Learn more about Pet Care in South Africa with TGM StatBox. Explore our detailed report, complete with graphs and tables, for in-depth insights.
Go to report


Connect with our expert team for immediate assistance or comprehensive market analysis. We are always ready to support your business needs.