South Africa’s population growth rate experienced significant fluctuations, influenced by socio-political changes, health crises, and economic conditions. In 1990, the rate peaked at 3.1%, reflecting high fertility rates and the end of apartheid. However, by 2000, the growth rate had dropped to 1.0%, primarily due to the devastating impact of the HIV/AIDS epidemic and its effect on mortality.
Recovery in growth rates occurred after 2006, with improved healthcare access and HIV treatment programs, leading to a steady rise up to 2.1% in 2015. The decline to 0.4% in 2017 mirrored economic challenges and emigration. By 2023, the rate stabilized at 0.9%, signaling a mix of improving healthcare and ongoing economic migration pressures. These trends underline the dynamic interplay of health, migration, and policy on South Africa's population growth.
Recovery in growth rates occurred after 2006, with improved healthcare access and HIV treatment programs, leading to a steady rise up to 2.1% in 2015. The decline to 0.4% in 2017 mirrored economic challenges and emigration. By 2023, the rate stabilized at 0.9%, signaling a mix of improving healthcare and ongoing economic migration pressures. These trends underline the dynamic interplay of health, migration, and policy on South Africa's population growth.
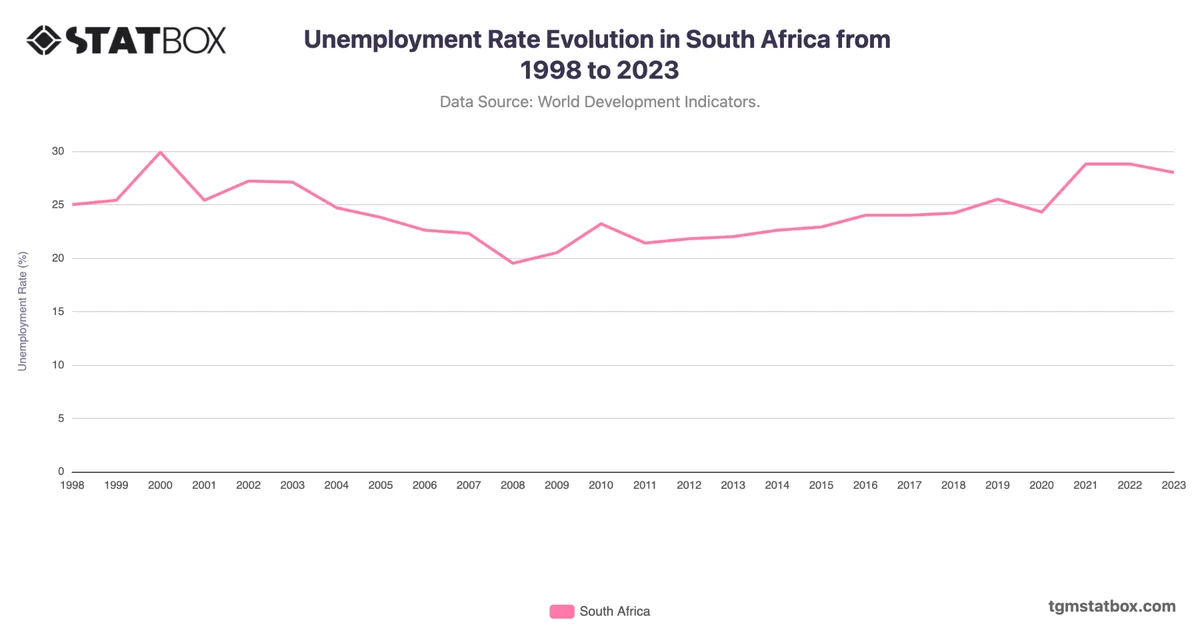
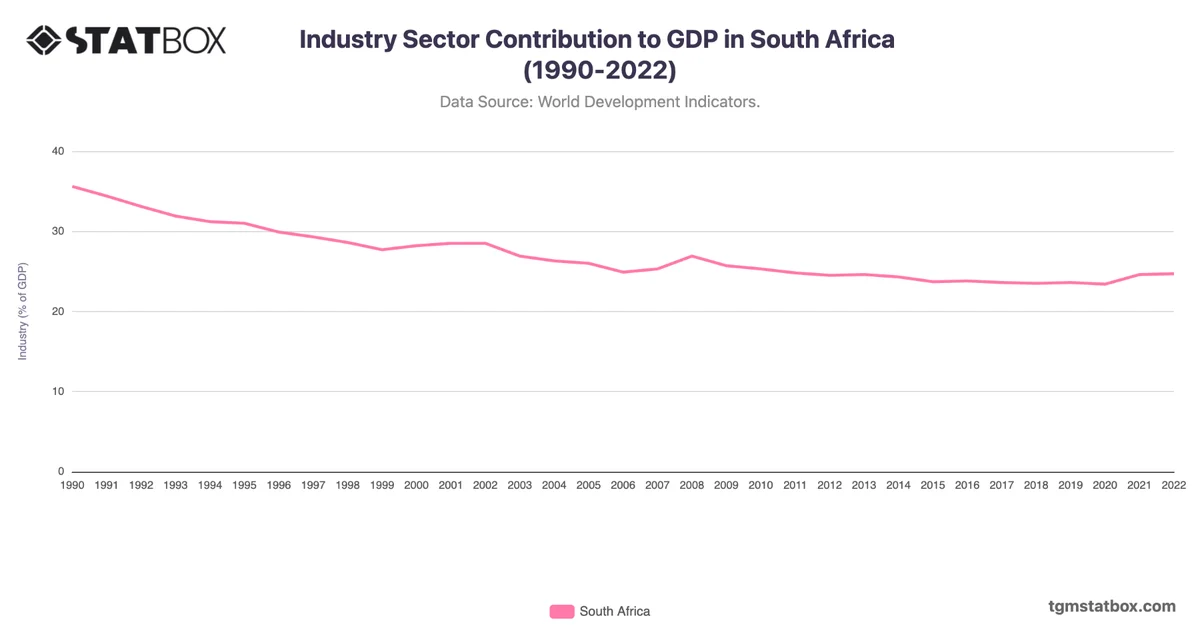
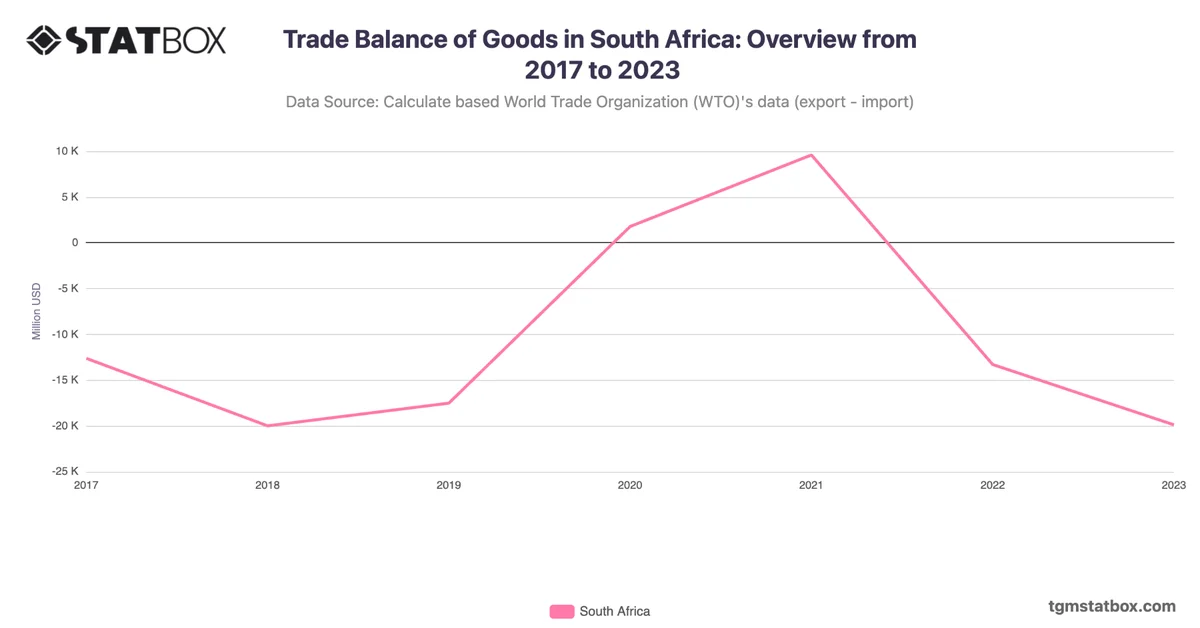
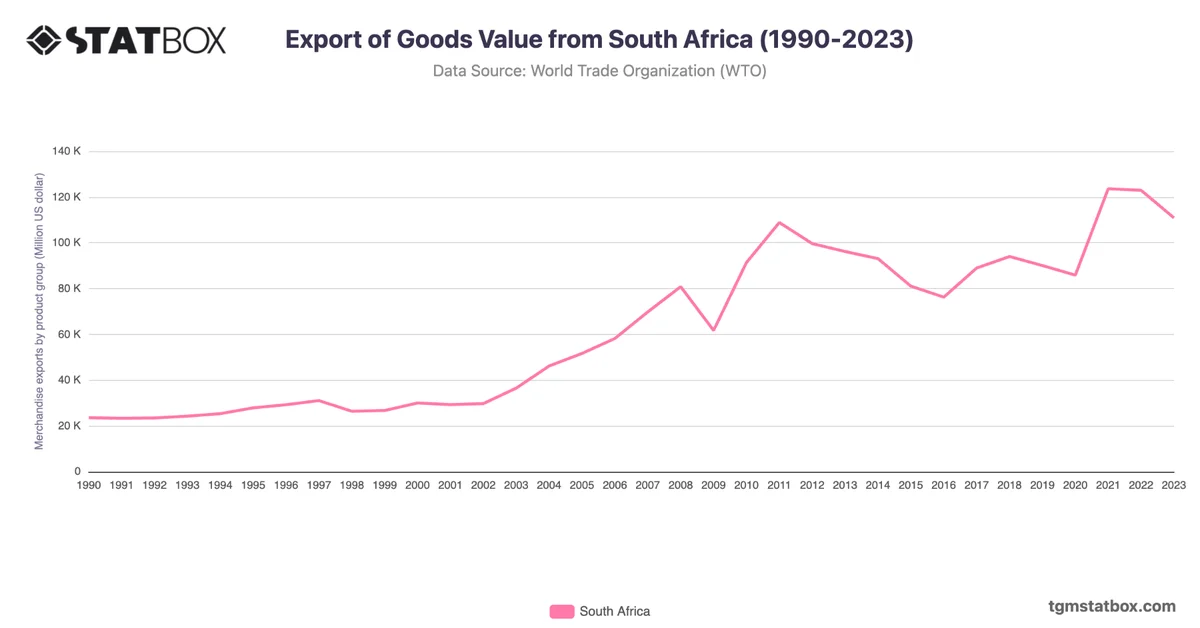
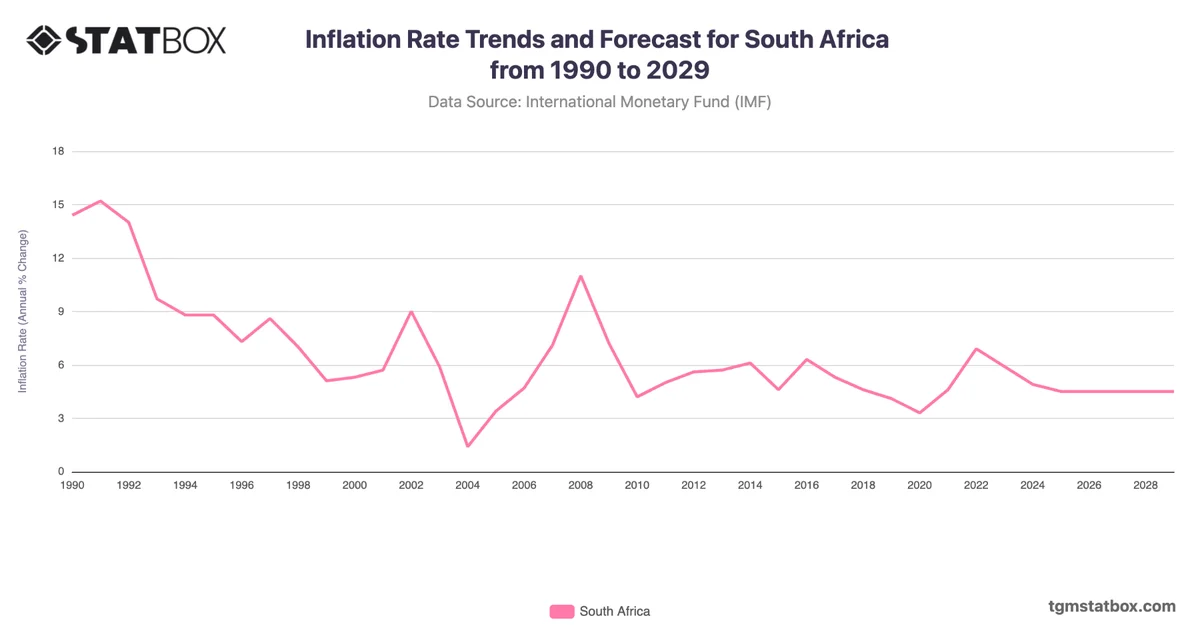
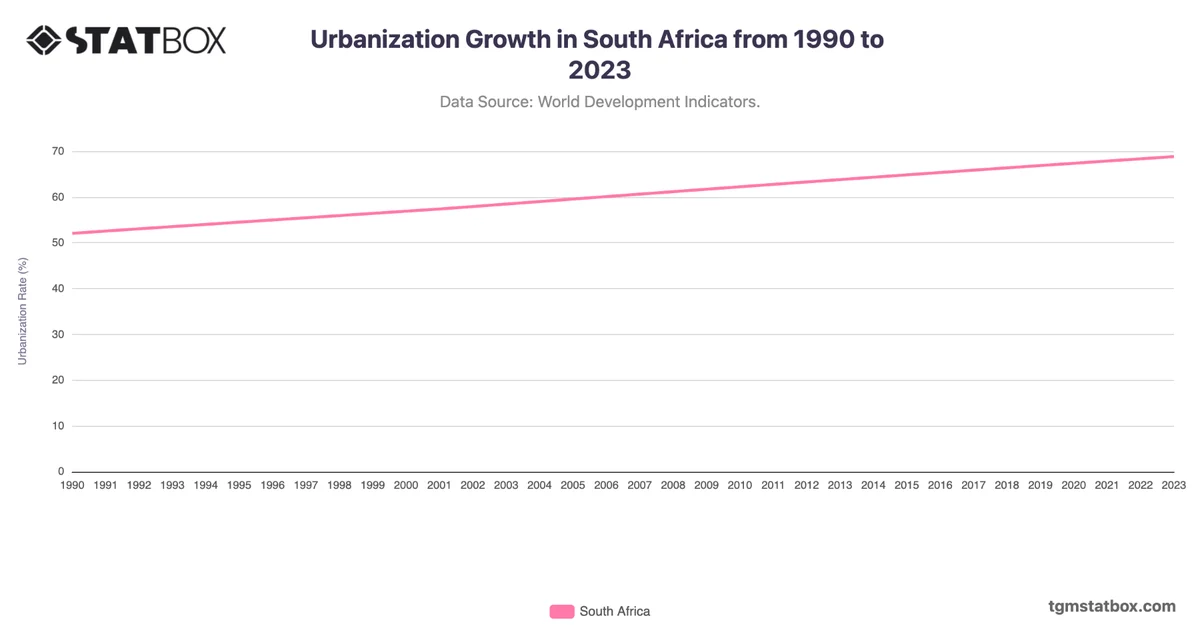
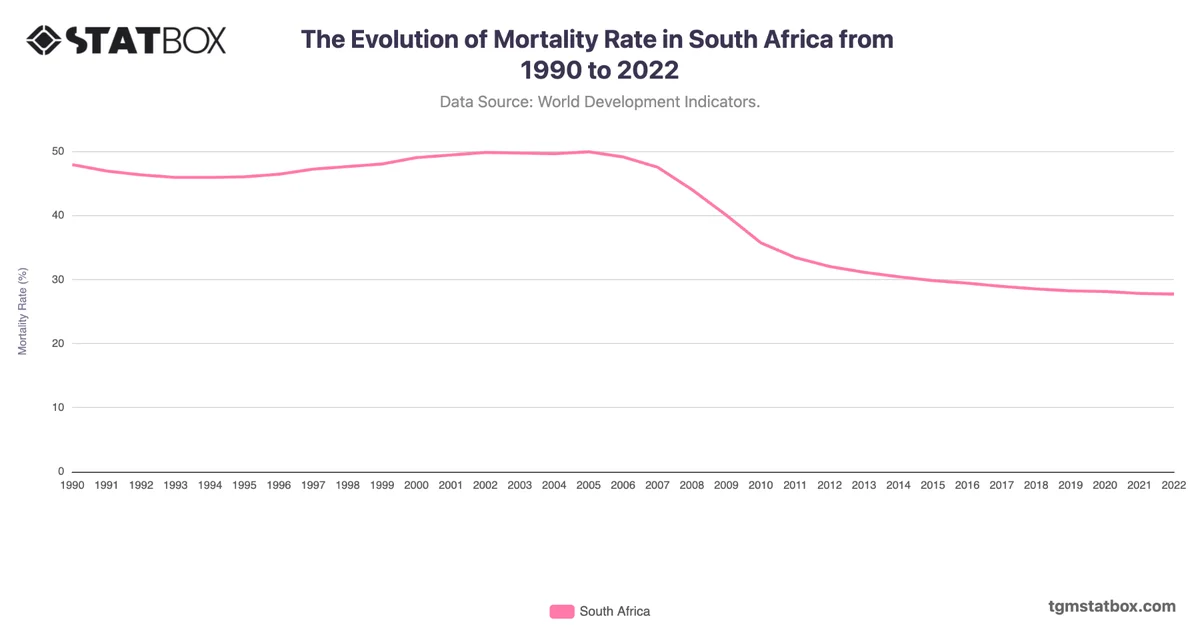
Explore related charts to gain a better understanding of South Africa’s working-age population share, South Africa’s annual GDP growth rate, evolving death rate in South Africa.