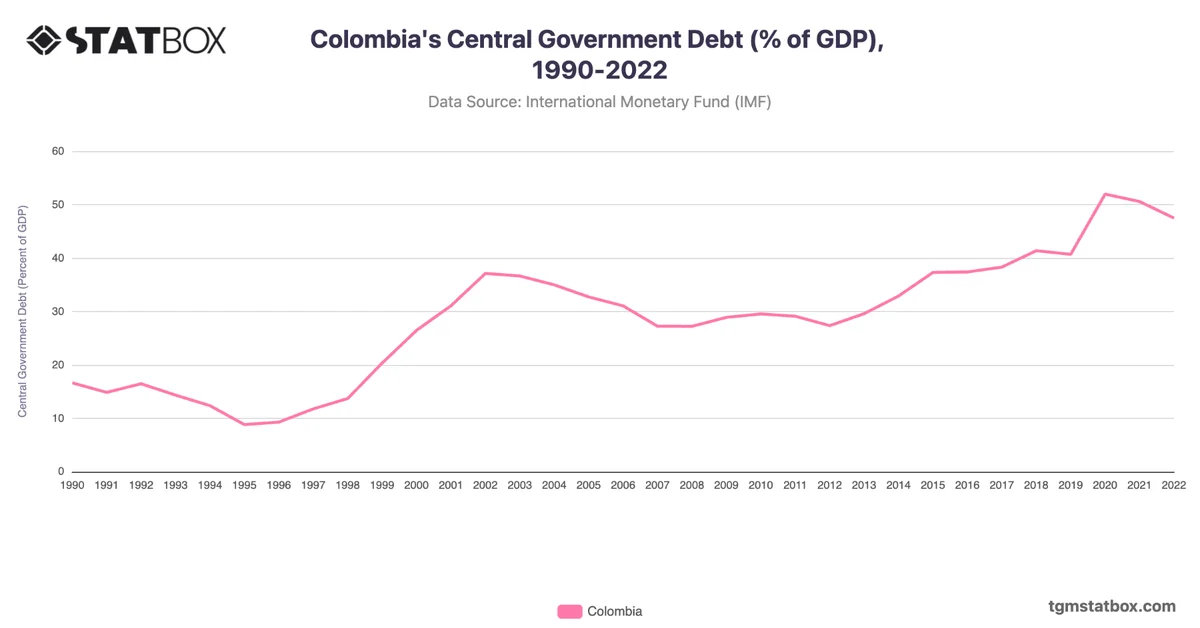
Colombia’s government debt as a percentage of GDP increased from 23.3% in 1996 to 47.5% in 2002, influenced by economic challenges and rising fiscal deficits. Efforts to stabilize the economy led to a reduction in debt in subsequent years, with the ratio decreasing to 32.4% by 2008. However, the global financial crisis and resulting economic slowdown contributed to an uptick in debt, with the ratio reaching 36.5% by 2010, as government spending rose to support economic growth.
From 2015 onward, debt levels grew significantly, peaking at 65.7% in 2020 due to the economic strain of the COVID-19 pandemic. Post-2020, debt levels remained high but slightly decreased to 63.6% by 2022. Colombia’s rising debt levels over the years reflect ongoing fiscal challenges and the impact of external shocks, underscoring the country’s efforts to balance economic growth with fiscal stability in a complex economic environment.
From 2015 onward, debt levels grew significantly, peaking at 65.7% in 2020 due to the economic strain of the COVID-19 pandemic. Post-2020, debt levels remained high but slightly decreased to 63.6% by 2022. Colombia’s rising debt levels over the years reflect ongoing fiscal challenges and the impact of external shocks, underscoring the country’s efforts to balance economic growth with fiscal stability in a complex economic environment.
Discover additional trends and data on Colombia’s net ODA received, Colombia’s military personnel ratio, Colombia’s annual GDP growth rate.