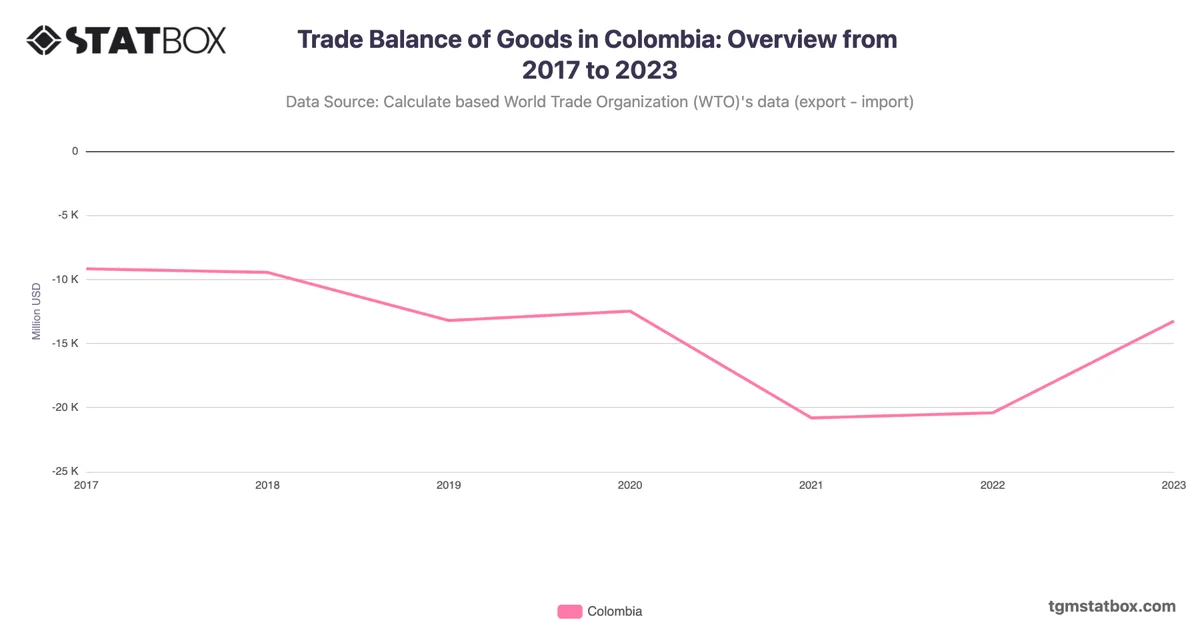
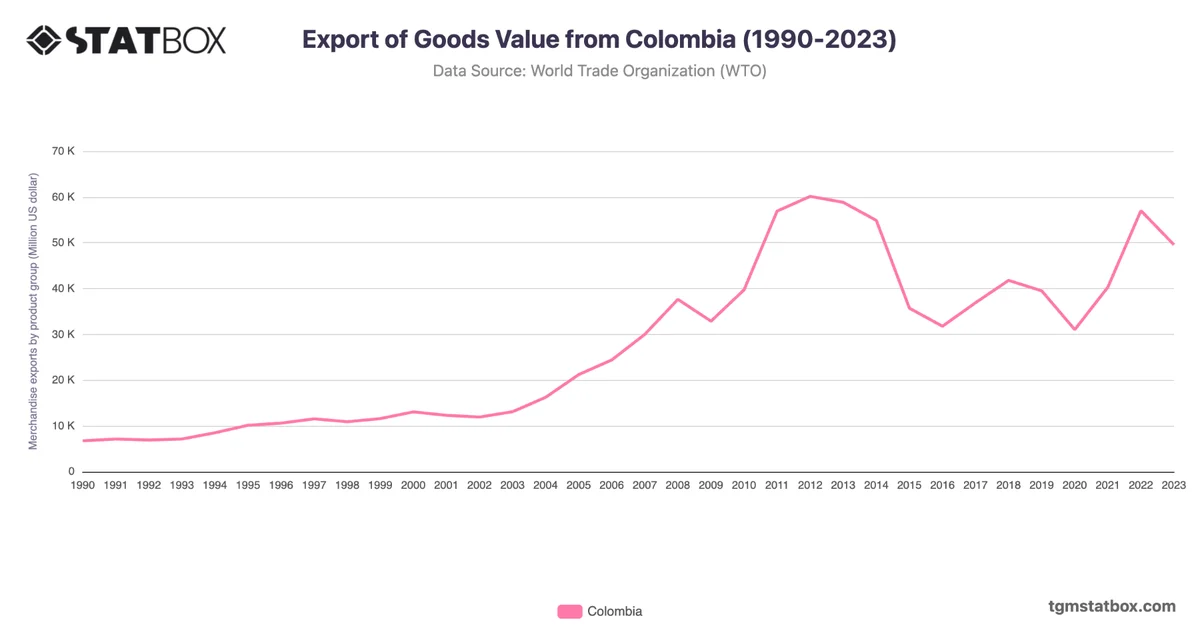
Colombia's import value increased from $5.5B in 1990 to $77.4B in 2022, supported by economic liberalization and infrastructure development. Imports grew significantly from $32.8B in 2009 to $54.2B in 2011 due to recovery efforts post-global financial crisis and investments in industrial sectors.
The peak in 2022 reflects increased consumer demand and energy imports. However, the 2023 decline to $62.7B highlights economic stabilization and adjustments in trade policies. Colombia's import trends showcase its reliance on industrial and consumer goods for economic expansion.
The peak in 2022 reflects increased consumer demand and energy imports. However, the 2023 decline to $62.7B highlights economic stabilization and adjustments in trade policies. Colombia's import trends showcase its reliance on industrial and consumer goods for economic expansion.
Find out more through related statistics on Colombia’s services sector share in GDP, Colombia’s population numbers, Colombia’s annual GDP growth rate.