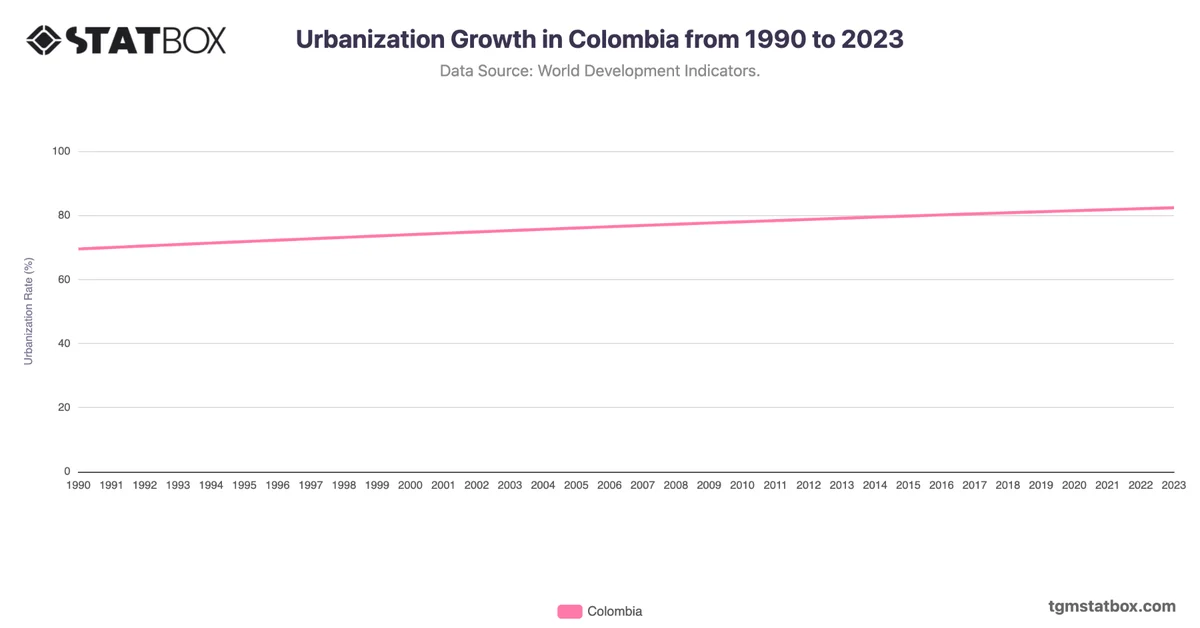
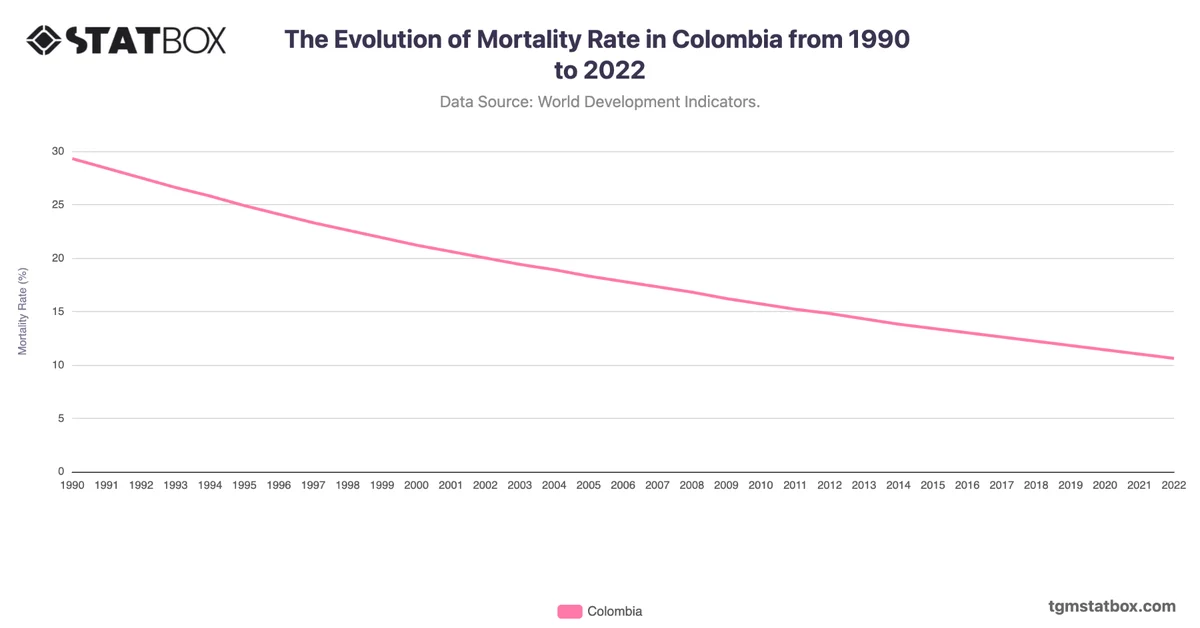
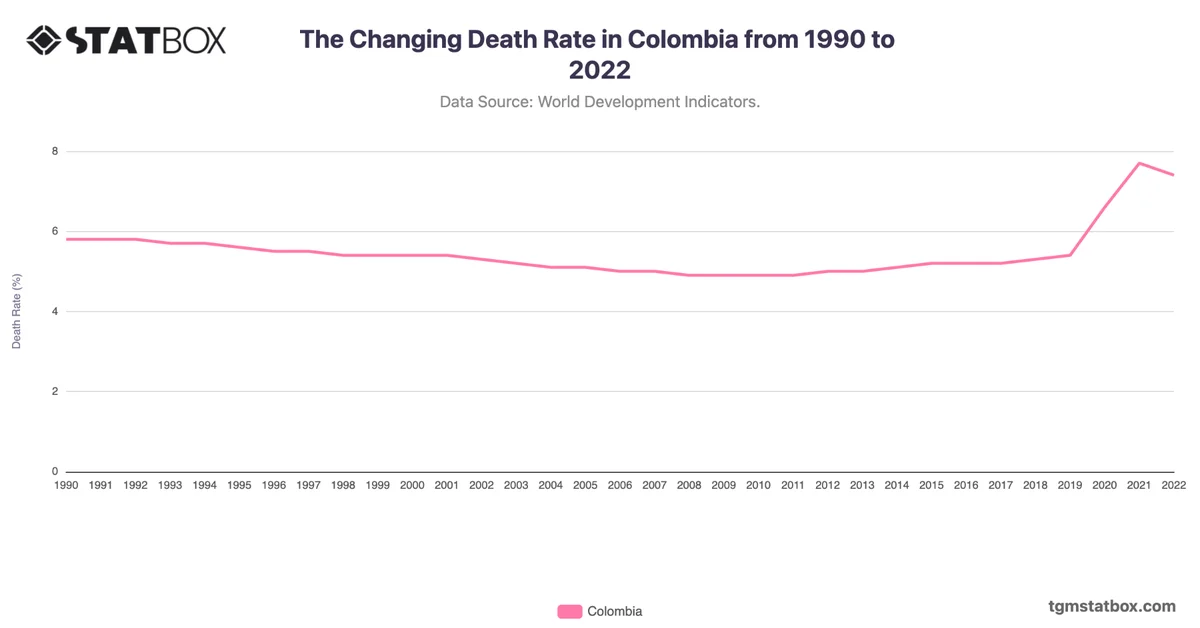
Colombia’s population growth experienced a consistent decline from 2.1% in 1990 to 1.0% in the early 2010s, driven by a demographic transition marked by declining fertility rates and urbanization. Political instability and economic challenges during the late 1990s also contributed to reduced population momentum, particularly in rural areas.
From 2016 to 2019, growth rates temporarily surged, reaching 1.9%, supported by a migration influx linked to regional crises. However, the 2020s saw another sharp decline, with growth dropping to 0.4% by 2023, as fertility rates remained low and economic pressures impacted migration patterns. This trend highlights Colombia's progression towards a more stable but slower-growing population.
From 2016 to 2019, growth rates temporarily surged, reaching 1.9%, supported by a migration influx linked to regional crises. However, the 2020s saw another sharp decline, with growth dropping to 0.4% by 2023, as fertility rates remained low and economic pressures impacted migration patterns. This trend highlights Colombia's progression towards a more stable but slower-growing population.
Gain a broader perspective by reviewing Colombia’s net lending/borrowing as a percentage of GDP, Colombia’s population numbers, Colombia’s population density.