Costa Rica's unemployment rate has reflected the nation’s mixed economic fortunes and structural shifts since 2001. Starting at 6.1%, the early 2000s were relatively stable, with only minor fluctuations. However, the 2008 global financial crisis resulted in an increase, with unemployment reaching 7.8% in 2009, demonstrating Costa Rica’s exposure to global economic cycles. Following a brief period of recovery, the rate surged again in the early 2010s, peaking at 10.8% in 2019, as economic growth slowed.
The COVID-19 pandemic caused a substantial rise, pushing the rate to 16.4% in 2020, one of the highest recorded. Costa Rica’s economy faced challenges in sectors such as tourism, a major contributor to employment, which were severely affected. By 2023, unemployment had reduced to 8.3%, indicative of the nation's gradual recovery and adaptation to post-pandemic economic conditions.
The COVID-19 pandemic caused a substantial rise, pushing the rate to 16.4% in 2020, one of the highest recorded. Costa Rica’s economy faced challenges in sectors such as tourism, a major contributor to employment, which were severely affected. By 2023, unemployment had reduced to 8.3%, indicative of the nation's gradual recovery and adaptation to post-pandemic economic conditions.
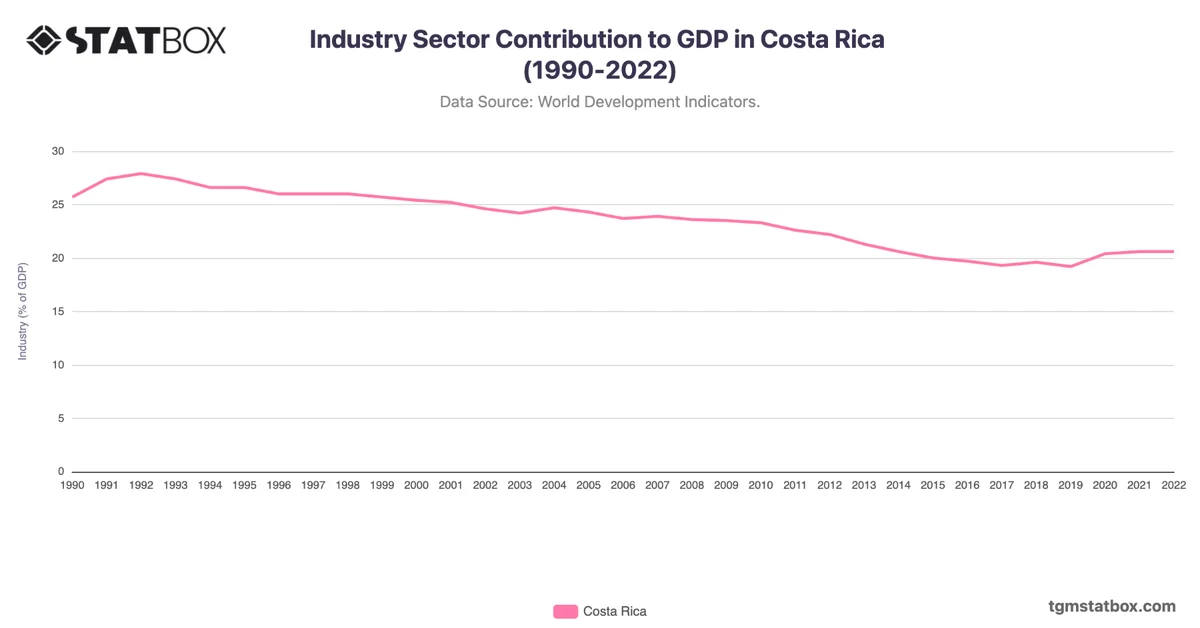
Explore related charts to gain a better understanding of Costa Rica’s population count, Costa Rica’s population growth rate, Costa Rica’s industrial sector GDP share.