Egypt's inflation has been characterized by volatility, with rates peaking at 23.5% in 2017 due to currency devaluation and subsidy reforms. Inflation moderated to 5.7% by 2020, benefiting from improved economic policies and stabilization measures. However, global price shocks and local currency pressures led to a sharp increase to 24.4% in 2023.
Looking ahead, inflation is expected to rise further to 32.5% in 2024 before declining to 6.1% by 2029. This trajectory highlights Egypt's ongoing economic challenges and the potential for recovery as fiscal policies are adjusted to mitigate external and domestic shocks.
Looking ahead, inflation is expected to rise further to 32.5% in 2024 before declining to 6.1% by 2029. This trajectory highlights Egypt's ongoing economic challenges and the potential for recovery as fiscal policies are adjusted to mitigate external and domestic shocks.
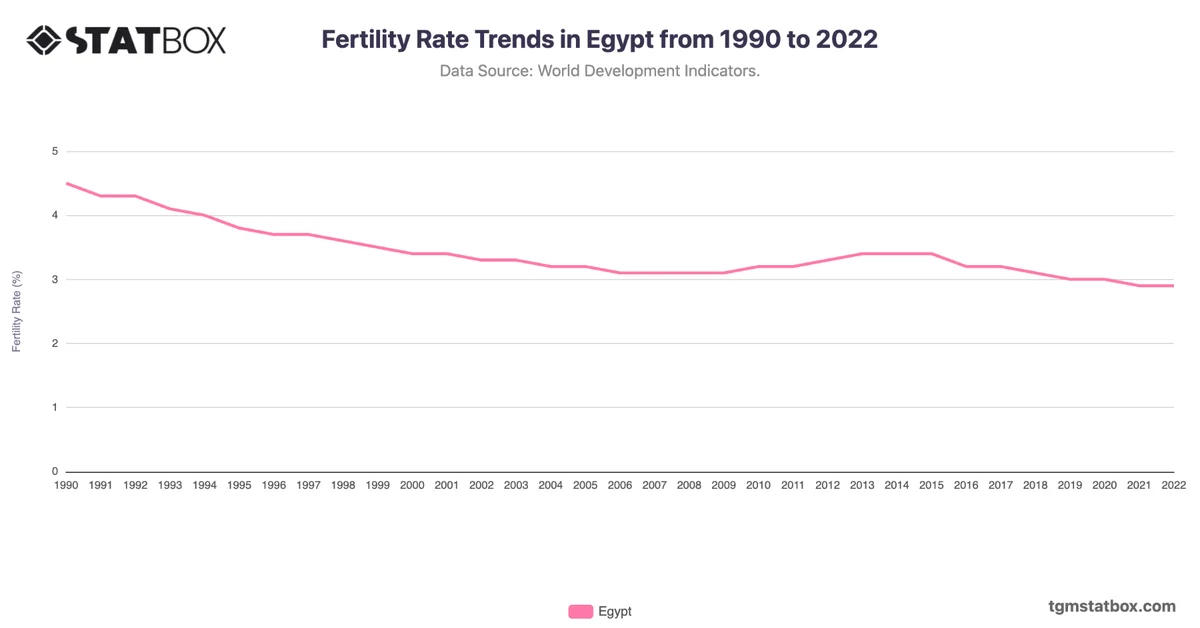
Explore related charts to gain a better understanding of Egypt’s annual GDP, Egypt’s military personnel ratio, Egypt’s fertility rate trends.