Share the statistic on social media channels or embed the statistic in your website using "Embed Code", where available.
Share chart
Embed chart Embed copied!Cite this statistic and select one of the following formats: APA, Chicago, Harvard, MLA & Bluebook
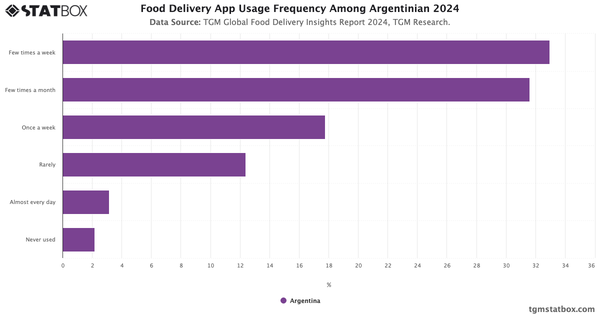
"How often do you use food delivery app?"
Key Takeaways
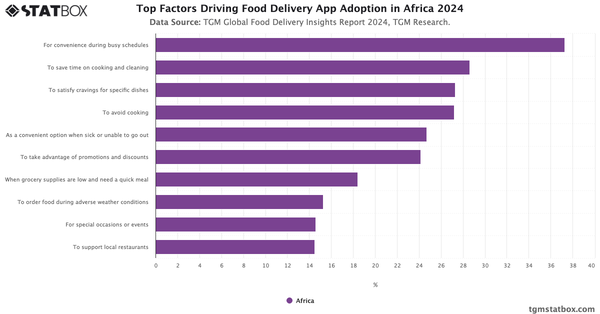
50.5% of African respondents using them at least once a week. Most commonly, people order a few times a week, followed by once a week and almost daily. Another 36.6% use these services a few times a month, suggesting that while not part of everyone’s daily routine, food delivery remains a regular option. Compared to regions like Asia or LATAM, where weekly usage tends to be higher, Africa’s engagement is solid but more moderate—reflecting a growing, yet still developing, adoption of food delivery habits.

Food Delivery Insights Report in Africa
Learn more about Food Delivery in Africa with TGM StatBox. Explore our detailed report, complete with graphs and tables, for in-depth insights.
Go to report


Connect with our expert team for immediate assistance or comprehensive market analysis. We are always ready to support your business needs.