France's government debt grew steadily from 26.16% in 1990 to 49.93% in 1998, reflecting increasing public spending and economic challenges. The global financial crisis caused a sharp increase, with the debt jumping from 55.25% in 2008 to 67.05% in 2009.
In subsequent years, debt continued to rise due to stagnant growth and high public spending, peaking at 93.38% in 2020 as the government implemented pandemic-related fiscal measures. Despite this, by 2022, the debt ratio stabilized at 92.15%, reflecting moderate fiscal consolidation efforts amidst persistent economic pressures.
In subsequent years, debt continued to rise due to stagnant growth and high public spending, peaking at 93.38% in 2020 as the government implemented pandemic-related fiscal measures. Despite this, by 2022, the debt ratio stabilized at 92.15%, reflecting moderate fiscal consolidation efforts amidst persistent economic pressures.
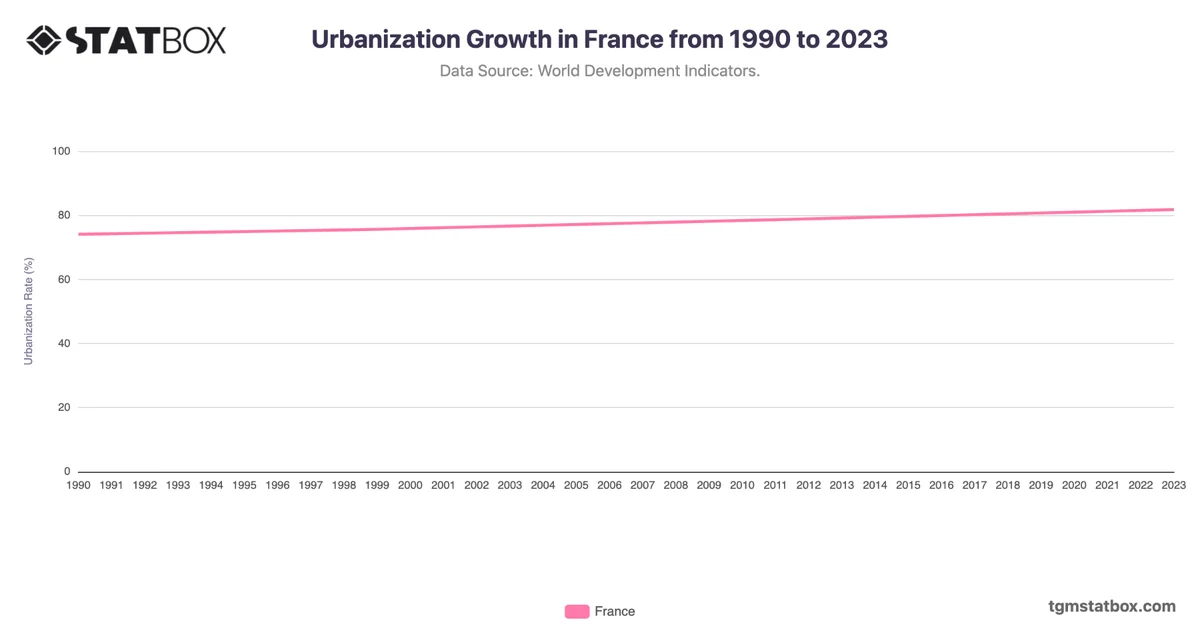
For additional information, visit statistics on France’s net lending/borrowing overview, urbanization rate in France, France’s annual GDP growth rate.