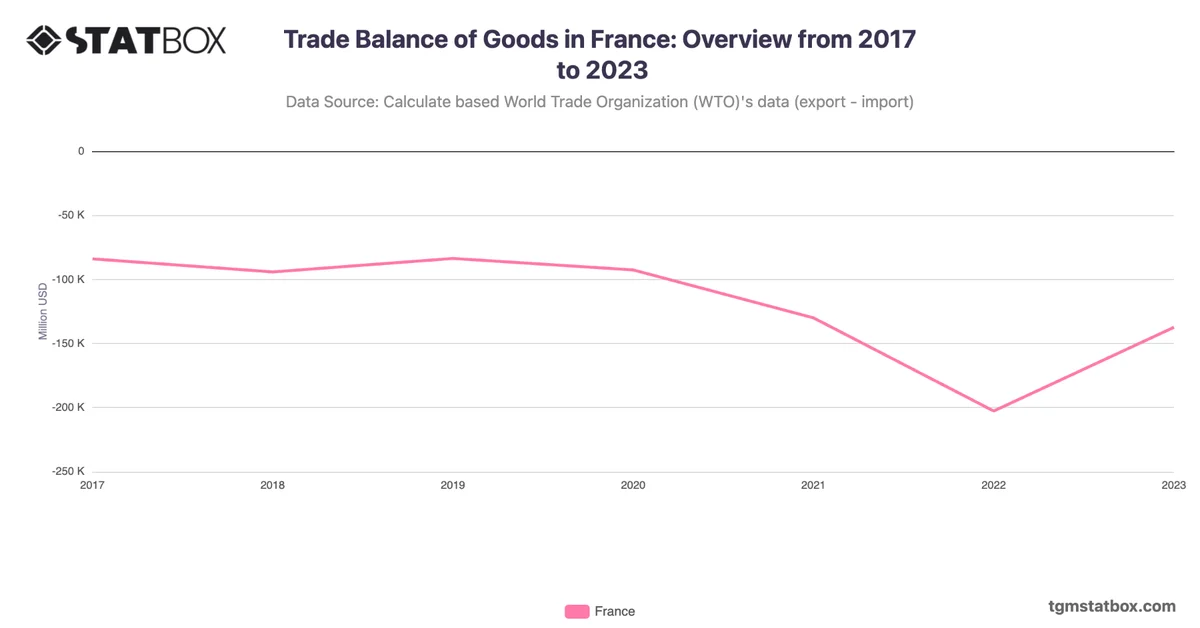
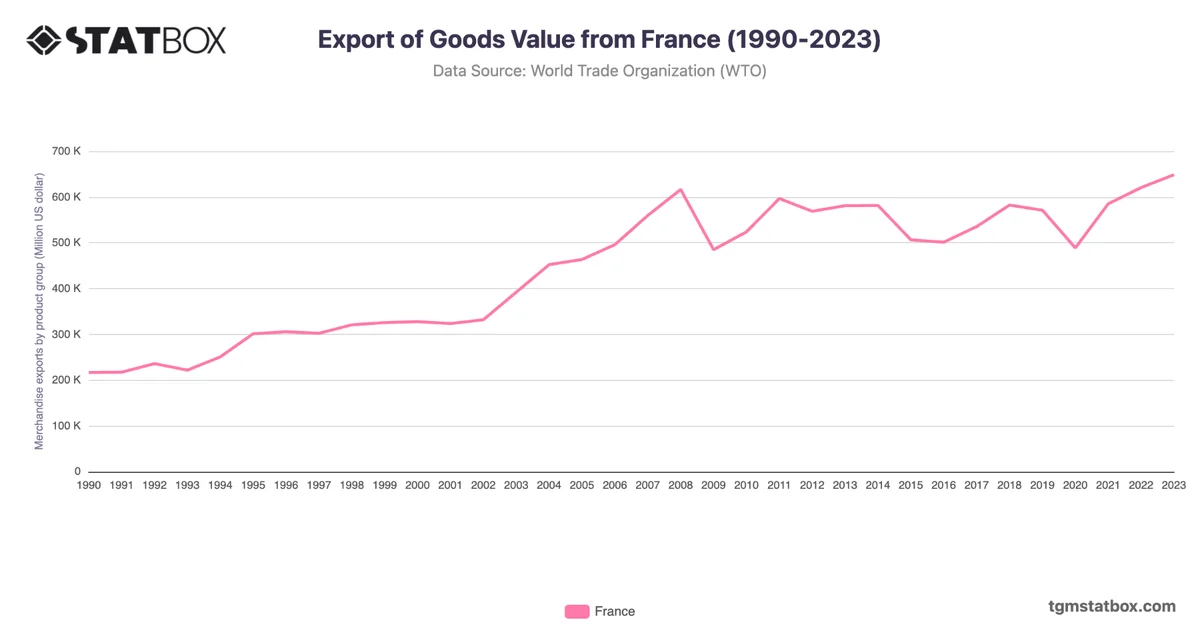
France’s imports rose from $234B in 1990 to $823.2B in 2022, reflecting its status as a major global economy. Growth accelerated in the early 2000s, with imports jumping from $329B in 2002 to $630B in 2007, driven by increased intra-EU trade and industrial demand. The 2008 financial crisis caused a contraction, but imports rebounded to $720B by 2011.
The peak of $823.2B in 2022 reflects rising energy costs and demand for advanced machinery and consumer goods. The 2023 decline to $786.1B suggests stabilization amid global economic adjustments. France’s import trajectory highlights its central role in the EU and its diversified economy.
The peak of $823.2B in 2022 reflects rising energy costs and demand for advanced machinery and consumer goods. The 2023 decline to $786.1B suggests stabilization amid global economic adjustments. France’s import trajectory highlights its central role in the EU and its diversified economy.
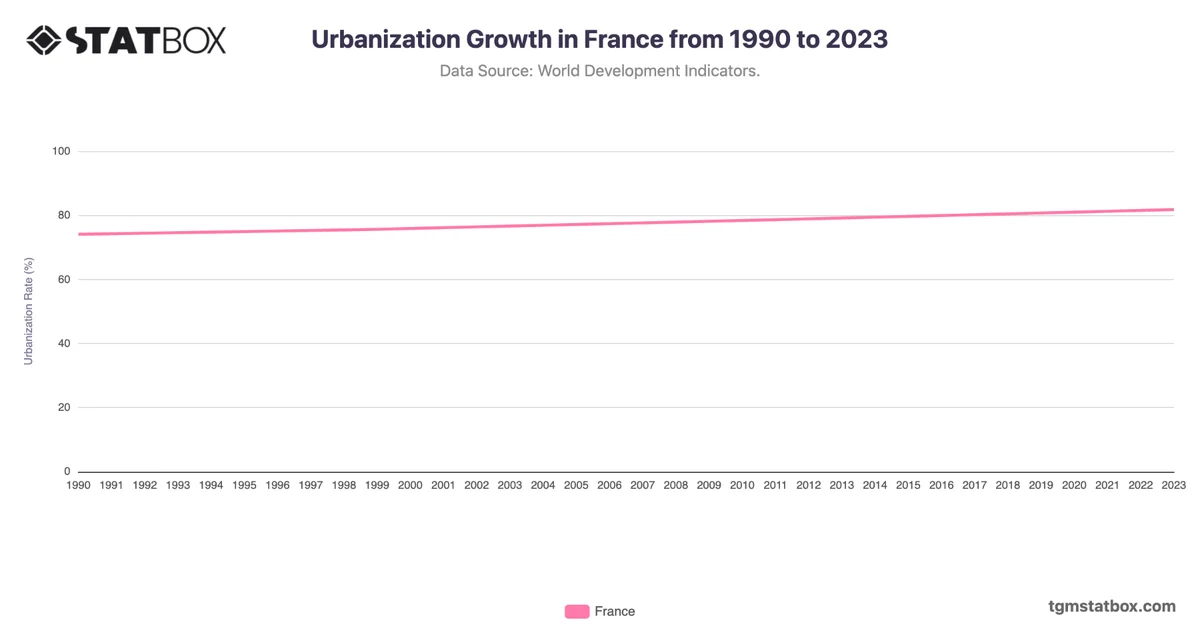
For additional information, visit statistics on France’s agriculture share in GDP, urbanization rate in France, France’s annual GDP growth rate.