Gender Differences in Pet Ownership Across the Philippines
Pet ownership is a meaningful dimension of household consumer behaviour, influencing spending across food, healthcare, accessories, and services. Understanding how ownership rates vary by gender provides a foundation for more precise audience segmentation and more targeted product or communication strategies in the Philippines.
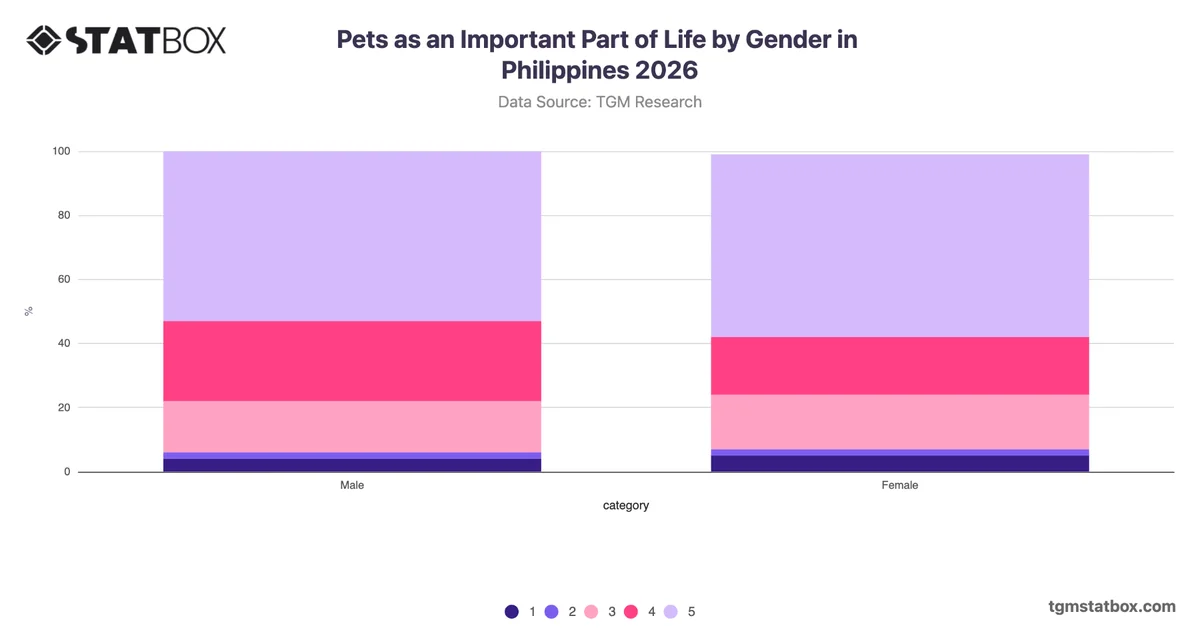
The most analytically notable aspect of the data is not simply that males report higher pet ownership, but that the gap between genders is moderate rather than negligible or pronounced. At 71% among males compared with 64% among females, a seven percentage point difference suggests a meaningful but not dramatic divergence in ownership rates. Both groups show majority ownership, which indicates that pet keeping is broadly normalised across genders in the Philippines rather than concentrated in one segment. The pattern points to a market where gender alone is unlikely to serve as a primary segmentation variable, yet the gap is large enough to warrant attention in campaign targeting. Organisations developing pet-related products or services may benefit from investigating whether this ownership gap translates into differences in category engagement, spending levels, or decision-making roles within households, rather than treating both groups as behaviourally equivalent.