Most Common Pets Owned in Ukraine 2024

Most Common Pets Owned in Ukraine 2024

Share the statistic on social media channels or embed the statistic in your website using "Embed Code", where available.

Share chart

Embed chart
Select Citation

Cite this statistic and select one of the following formats: APA, Chicago, Harvard, MLA & Bluebook


  • APA
  • Chicago
  • Harvard
  • MLA
  • Bluebook
  • IEEE
TGM StatBox. (2024). Most Common Pets Owned in Ukraine 2024. TGM StatBox.
Chart Details
Timeframe: 2024
Country: Ukraine
Type of survey: CAWI
Number of respondents: 333
Age group: 18 - 64
Published date: 2024
Survey Question: "What kind of pet(s) do you have personally? (those have more than 1 pet)"
Key Takeaways
Among respondents, dogs are owned by approximately 70.9%, while a remarkable 86.3% report having cats. Additionally, the data shows that while turtles, rabbits, hamsters, and parrots are owned, they comprise a significantly smaller percentage of the pet population, with less than 10% for each.

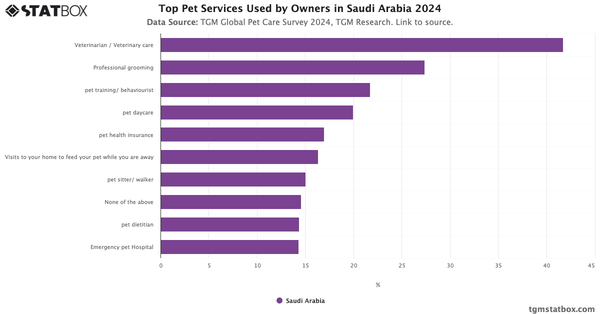
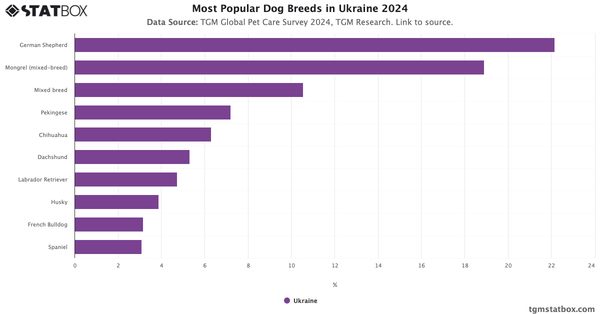
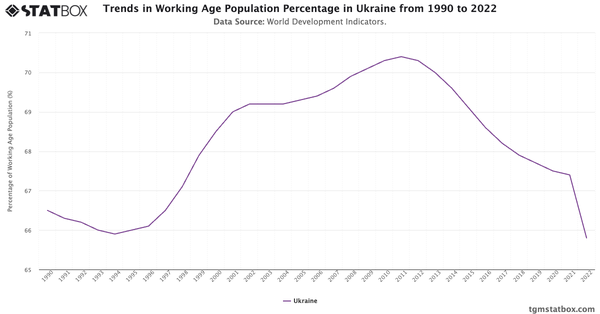
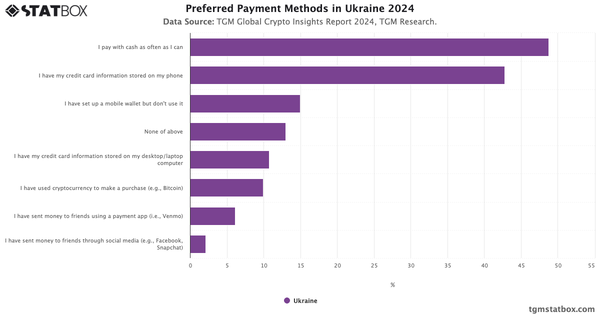
Discover additional trends and data on Ukrainian pet ownership trends, most popular pet services in Ukraine, best sources for pet care advice in Ukraine.

Would you like to know more?
Check our report on this topic

Pet Care Insights Report in Ukraine

Pet Care Report in Ukraine 2024

Pet Care Insights Report in Ukraine

Discover insights into Pet Care in Ukraine with TGM StatBox. Access our detailed report, including graphs and tables, to uncover the industry's trends.

Go to report

Further Recommended Statistics

Statbox vector
Statbox |form contact icon

Have Other Queries?

Statbox vector

Connect with our expert team for immediate assistance or comprehensive market analysis. We are always ready to support your business needs.