Share the statistic on social media channels or embed the statistic in your website using "Embed Code", where available.
Share chart
Embed chart Embed copied!Cite this statistic and select one of the following formats: APA, Chicago, Harvard, MLA & Bluebook
The GDP growth rate in the context of the World Development Indicators (WDI) refers to the annual percentage increase or decrease in a country's Gross Domestic Product (GDP), adjusted for inflation. The WDI is a comprehensive database maintained by the World Bank that tracks various economic, social, and environmental development indicators across the globe.
Key Takeaways
The Netherlands GDP Growth (1961-2023)
The Netherlands’ GDP growth rate reveals resilience despite global crises. The post-war era saw strong growth, peaking at 8.6% in 1965. The economy faced challenges in the 1980s with mild contractions. Recovery followed, with steady growth into the 2000s. After a severe decline in 2009 during the financial crisis, the Netherlands bounced back, growing by 6.2% in 2021. However, growth slowed to 0.1% in 2023, reflecting inflationary pressures and global economic uncertainties.
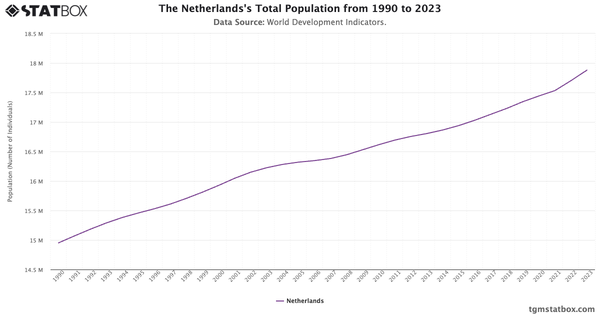
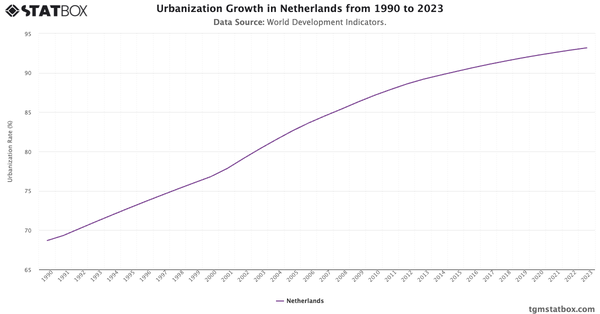
For a broader context, visit other statistics on Netherlands’ population growth, urbanization rate in the Netherlands, Netherlands’ annual GDP.


Connect with our expert team for immediate assistance or comprehensive market analysis. We are always ready to support your business needs.