The Netherlands maintained a relatively stable fertility rate, fluctuating between 1.5 and 1.8 from 1990 to 2022. The rate remained consistent at around 1.6–1.7 during the 1990s and 2000s, indicative of a developed nation with widespread access to healthcare, family planning, and economic stability.
A slight increase to 1.8 was observed in the late 2000s and early 2010s, potentially driven by favorable parental leave policies and support for working families. However, the rate dipped to 1.5 in 2022, reflecting broader European trends of aging populations and lower birth rates due to changing lifestyle preferences and economic uncertainties.
A slight increase to 1.8 was observed in the late 2000s and early 2010s, potentially driven by favorable parental leave policies and support for working families. However, the rate dipped to 1.5 in 2022, reflecting broader European trends of aging populations and lower birth rates due to changing lifestyle preferences and economic uncertainties.
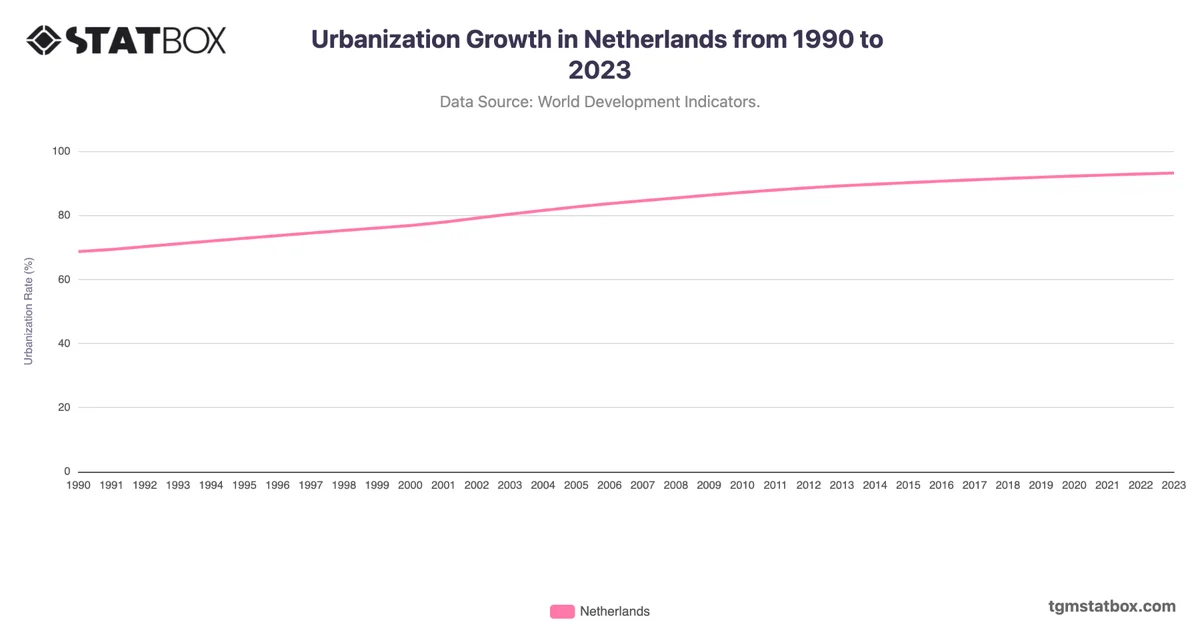
Find out more through related statistics on Netherlands’ population density, Netherlands’ annual GDP growth rate, urbanization rate in the Netherlands.