Strength and Selectivity in Turkish Pet Attitudes
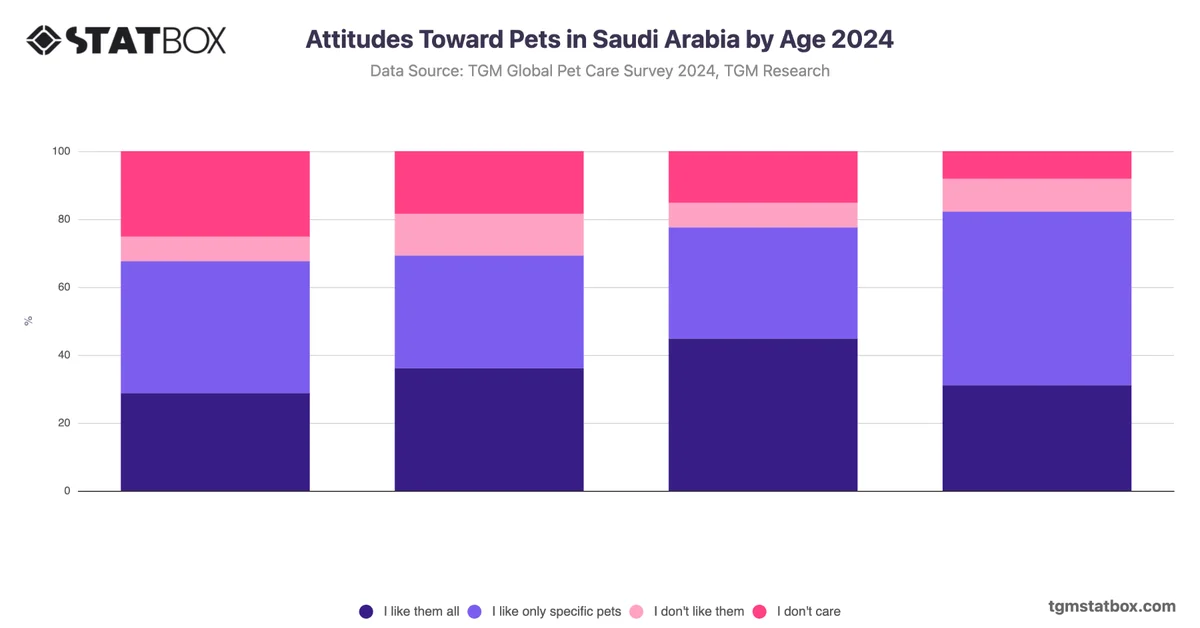
Consumer attitudes toward pets shape purchasing behaviour, product positioning, and the overall commercial viability of the pet care sector. In Turkey, cultural relationships with pets vary by species and context, making attitude segmentation a meaningful input for any organisation operating in or entering this market.
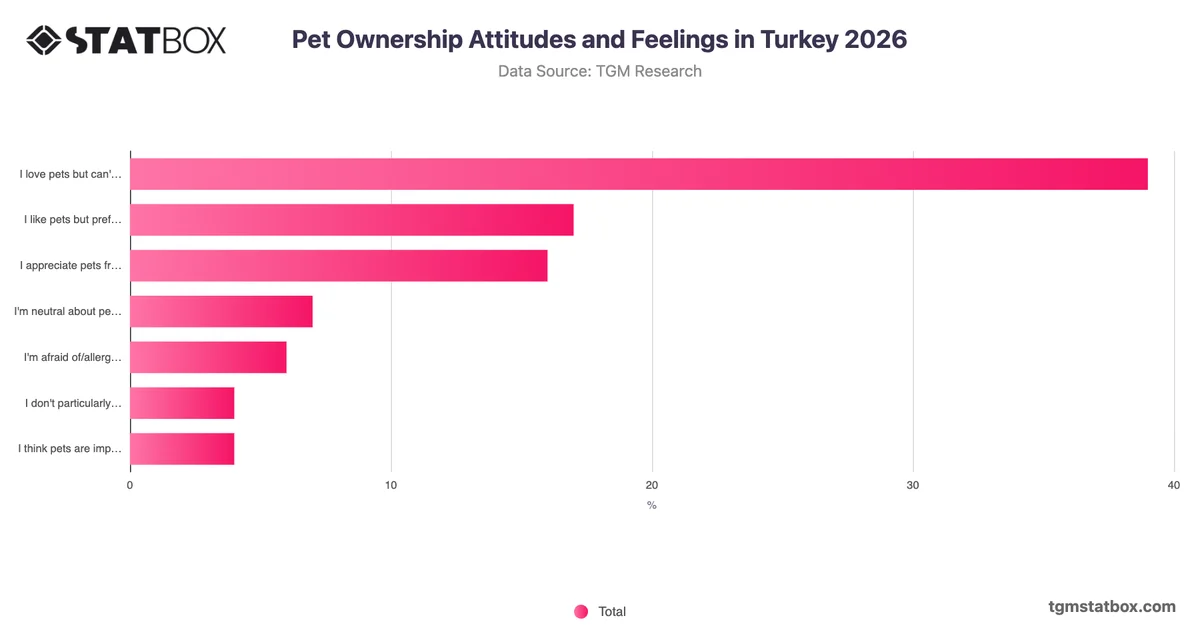
The most analytically significant pattern in Turkish pet attitudes is the combination of strong unconditional affinity and meaningful selectivity. Nearly three in five respondents express love for all types of pets, while a further 27% hold positive but conditional views, preferring certain pets over others. Together, these two groups account for 86% of the population, yet their commercial implications differ considerably. The unconditional segment is likely more receptive to broad pet care messaging, whereas the selective group may respond more readily to category-specific or species-specific positioning. Negative sentiment, including indifference, dislike, and fear or allergy, remains limited to roughly one in seven respondents. This suggests that organisations should prioritise developing distinct communication strategies that address unconditional pet lovers and selective consumers separately, rather than treating positive pet attitudes as a single, uniform audience.