Latent Pet Affinity Versus Practical Ownership Barriers in Turkey
Pet ownership sits at the intersection of lifestyle preferences, household circumstances, and personal values. In Turkey, attitudes toward pets carry commercial weight for sectors ranging from retail and veterinary services to housing and consumer goods, making a clear understanding of where affinity ends and commitment begins particularly relevant for market positioning.
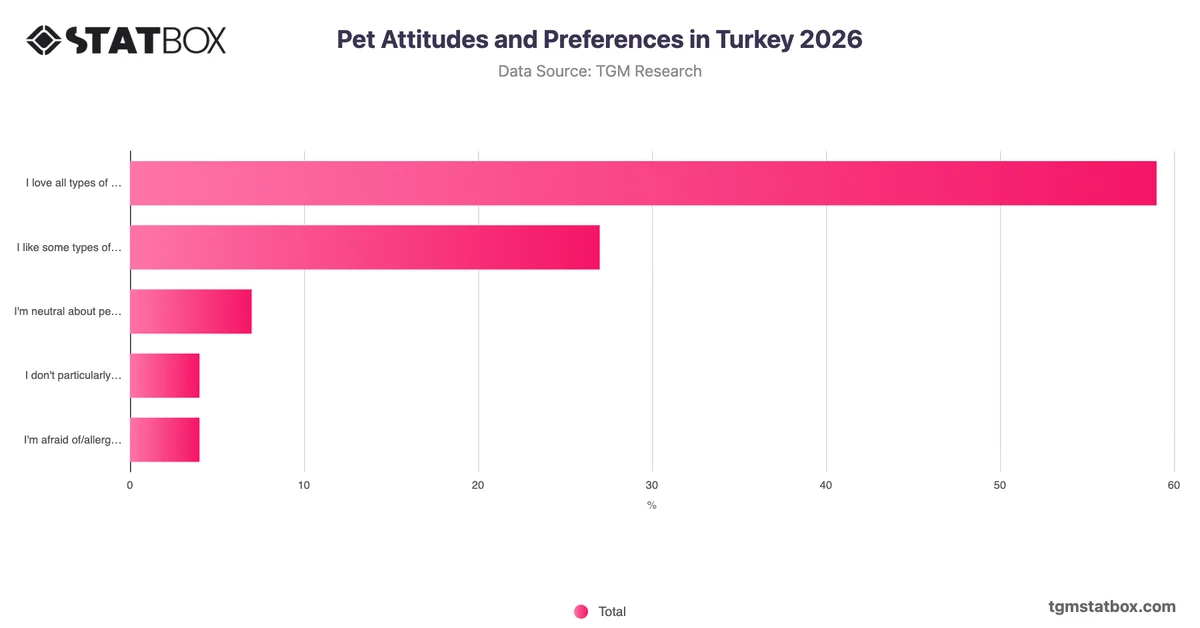
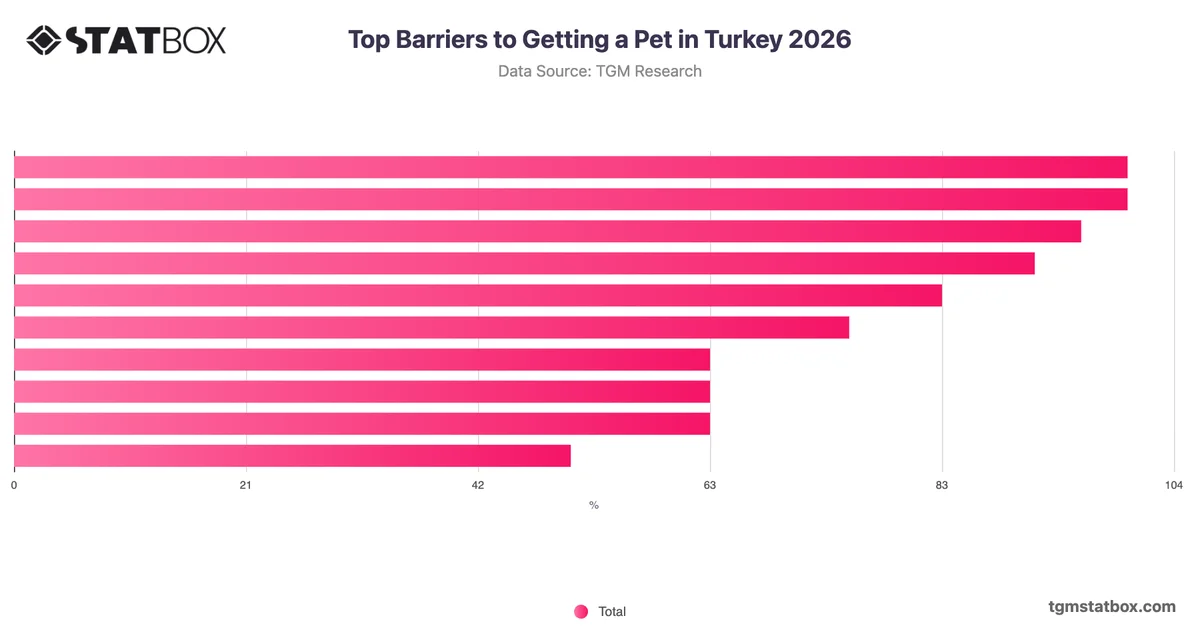
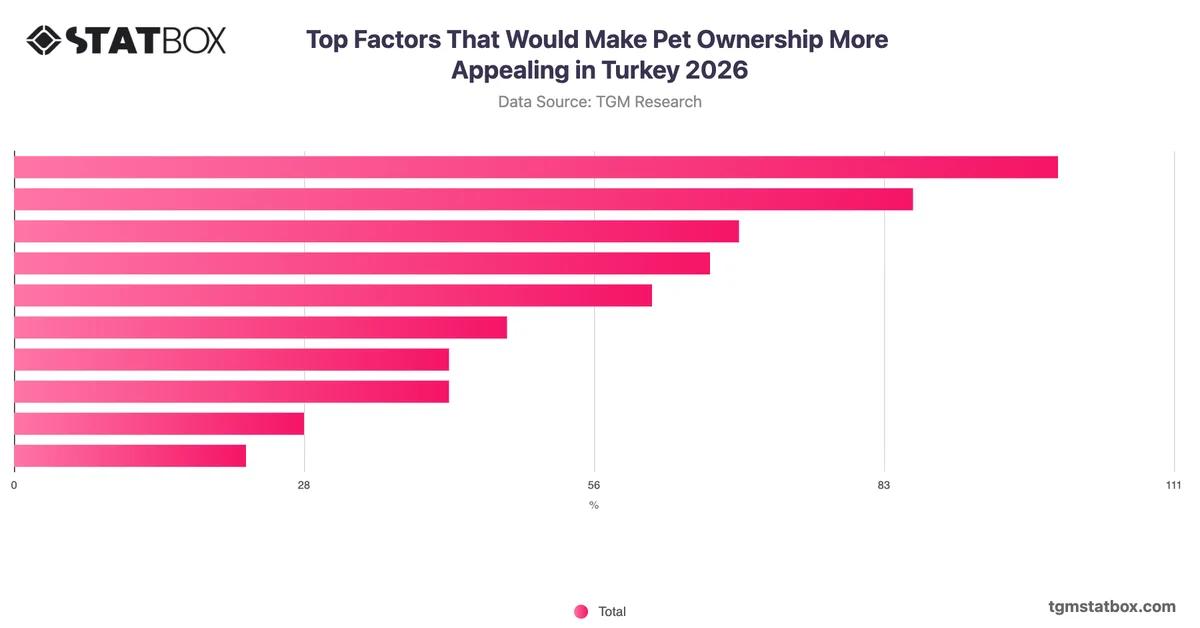
The most analytically significant pattern in Turkish pet attitudes is the gap between emotional affinity and actual ownership readiness. Nearly four in ten respondents express genuine fondness for pets yet cite current constraints preventing ownership, while a further 16% appreciate pets from a distance and 17% prefer not to own one despite liking them. Together, these groups suggest that positive sentiment toward pets is broadly distributed across the population, but willingness to take on ownership responsibilities is considerably more limited. Outright indifference or aversion accounts for a relatively small combined share. This mismatch between affinity and commitment indicates that demand for pet ownership is not suppressed by negative attitudes but by practical or situational barriers. Organisations targeting this market may find greater traction by addressing specific ownership obstacles, such as space, cost, or time constraints, rather than investing in campaigns aimed at building general pet positivity.