Pet Ownership Penetration and Non-Owner Majority in South Korea
Pet ownership intersects with household lifestyle decisions, consumer spending priorities, and the broader animal care industry. In South Korea, the relationship between urban living conditions, household size, and the decision to keep pets shapes demand across food, veterinary services, accessories, and related categories, making ownership penetration a meaningful indicator of addressable market scope.
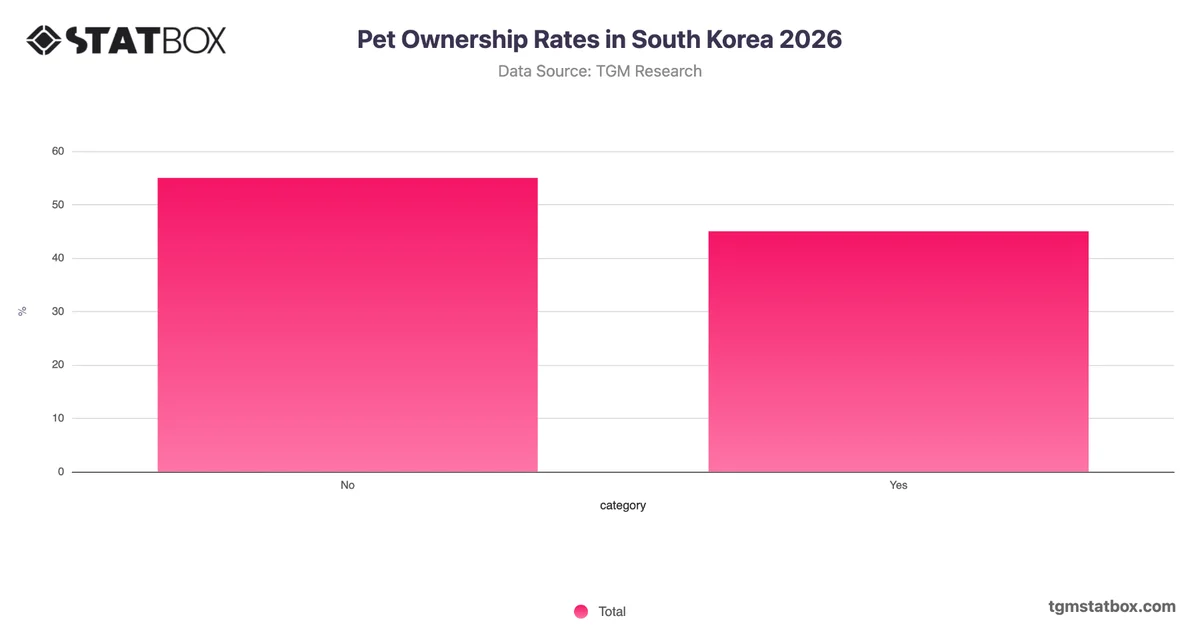
The most analytically significant pattern in South Korean pet ownership is the clear non-owner majority. With 61% of respondents reporting no current pet, and 39% confirming ownership, the gap of 22 percentage points indicates that pet keeping remains a minority behaviour rather than a broadly adopted lifestyle choice. This suggests the market, while commercially active, is concentrated within a defined segment rather than distributed across the general population. For organisations operating in pet-related categories, this concentration points to the importance of depth of engagement with existing owners rather than assuming broad household penetration. Product positioning, subscription services, and loyalty programmes may deliver stronger returns when targeted precisely at confirmed owners, while any strategy aimed at converting non-owners should first investigate the structural barriers, whether space, cost, or lifestyle compatibility, that sustain the current majority.