Share the statistic on social media channels or embed the statistic in your website using "Embed Code", where available.
Share chart
Embed chart Embed copied!Cite this statistic and select one of the following formats: APA, Chicago, Harvard, MLA & Bluebook
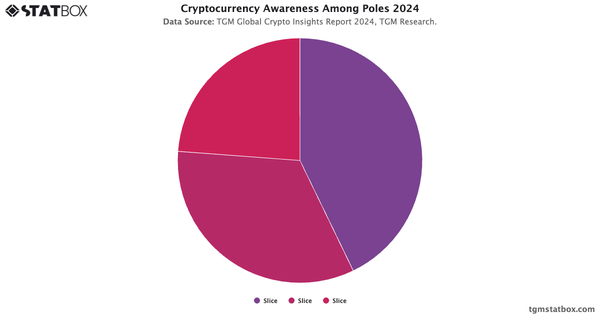
"Which of the following statements about paying for things are true for you?"
Key Takeaways
Cash remains the preferred payment method for 41.85% of people in Spain. Despite the rise of digital payment methods, cash still holds significant relevance, especially among certain consumer groups who may be more cautious about adopting newer technologies or simply prefer the tactile experience of cash transactions. On the other hand, a sizable but smaller group of people have their credit card information stored on their phones, and some also use payment apps like Venmo to send money, pointing to a clear trend of growing digital engagement.
For additional information, visit statistics on Spaniards’ cryptocurrency awareness, Top cryptocurrency exchanges in Spain, Spain’s cryptocurrency adoption.

Cryptocurrency Insights Report in Spain
Discover all you need to know about Cryptocurrency owners in Spain with TGM StatBox. Get the comprehensive insights report, featuring graphs and tables.
Go to report


Connect with our expert team for immediate assistance or comprehensive market analysis. We are always ready to support your business needs.