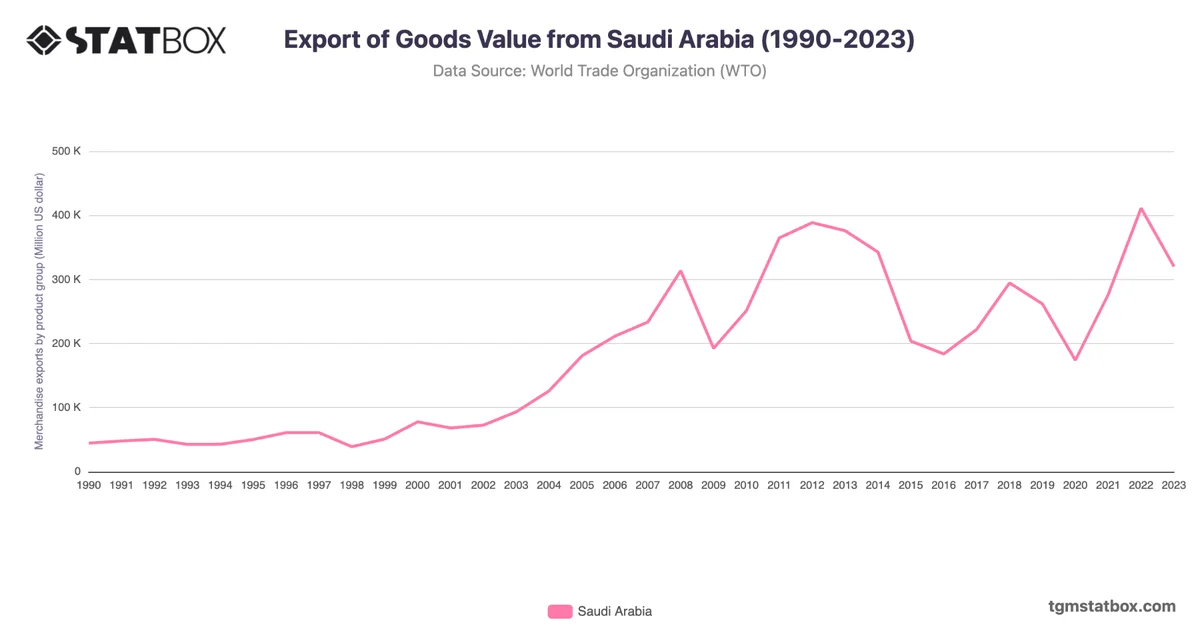
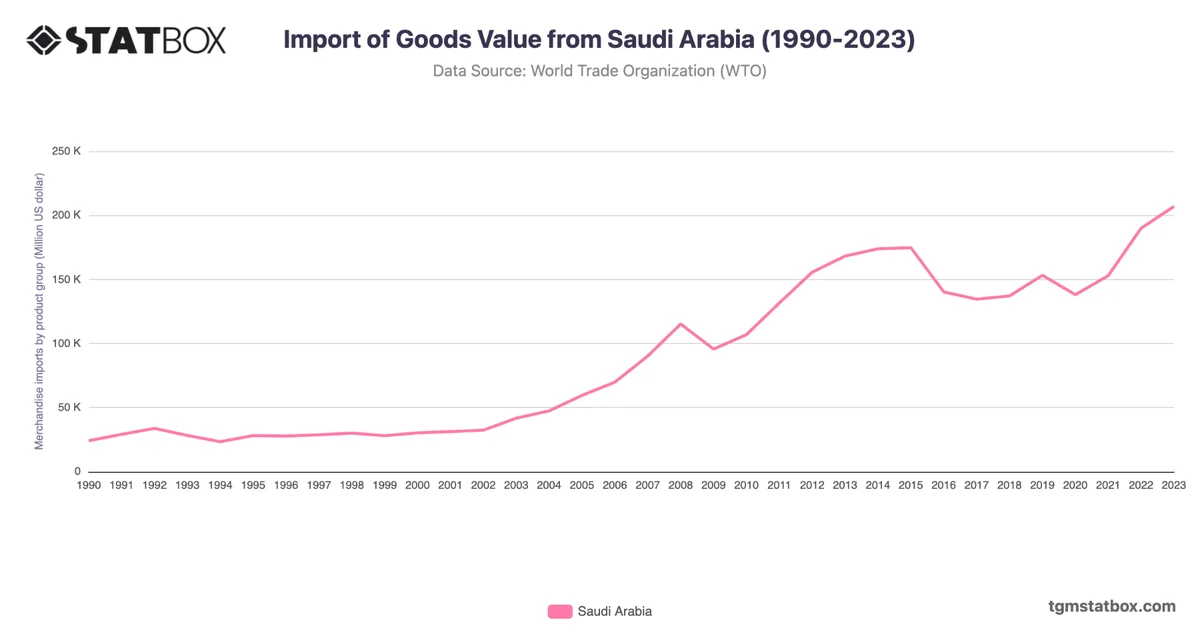
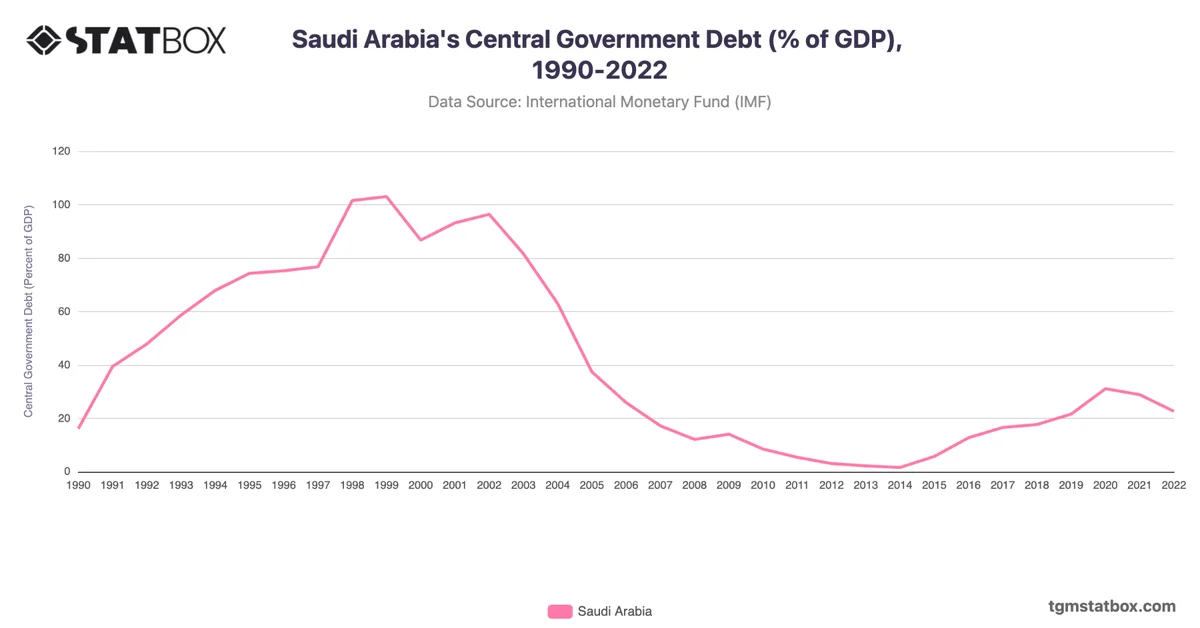
Saudi Arabia's industry sector contribution to GDP has been heavily influenced by its dominant oil sector, which has long defined the nation's economy. In the early 1990s, industry’s share was around 48.6%, driven by a robust oil market that fueled government revenue and public investment. By the early 2000s, high global oil prices resulted in a substantial increase in industry contribution, reaching a peak of 66.5% in 2008. This peak aligned with a global oil price boom that elevated oil production and export values, reinforcing Saudi Arabia’s reliance on the sector for GDP growth.
However, the oil price collapse in 2014 significantly impacted industrial contributions, bringing the share down to 44.7% by 2015. In response, Saudi Arabia launched Vision 2030, an ambitious diversification plan aimed at reducing its dependency on oil. Through Vision 2030, Saudi Arabia has invested heavily in non-oil sectors such as tourism, renewable energy, and technology, which aim to create a more balanced economic structure. Despite these efforts, oil remains critical to the economy, as seen in the partial recovery to 53.2% in 2022, buoyed by rising oil prices post-pandemic. This recent rebound underscores Saudi Arabia’s ongoing transition, where the oil industry still commands significant influence while new sectors are emerging as part of the nation’s long-term economic strategy.
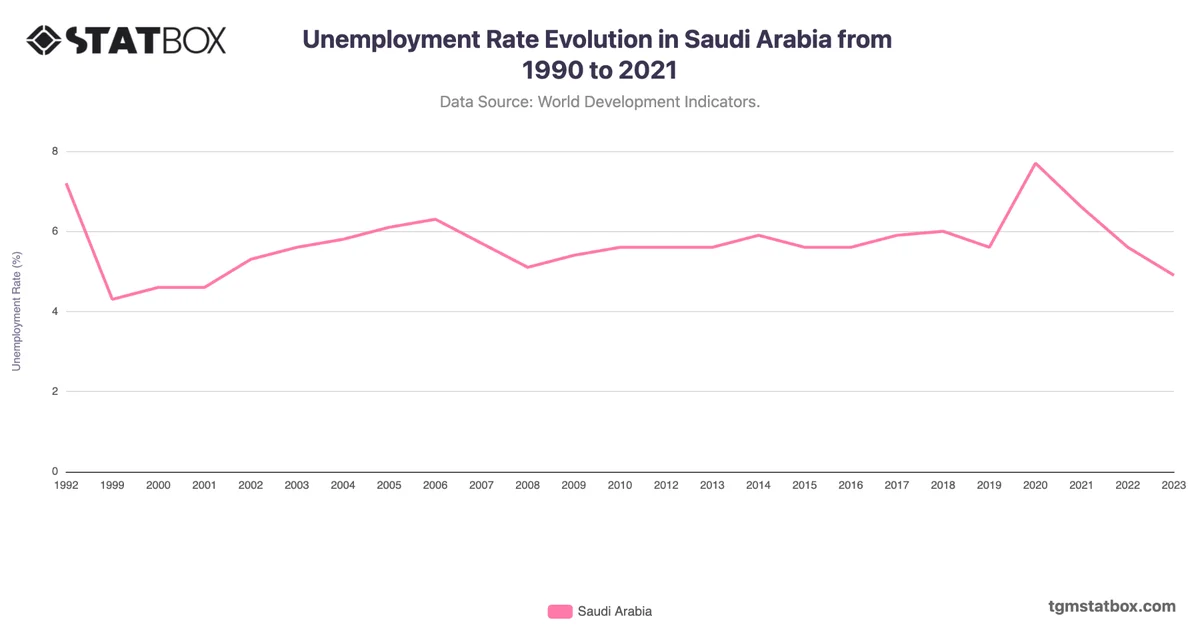
Find out more through related statistics on Saudi Arabia’s unemployment rate trends, Saudi Arabia’s manufacturing sector share in GDP, Saudi Arabia’s annual GDP growth rate.