China's import growth, from $53.3B in 1990 to a peak of $2.7T in 2022, reflects its rise as a global economic powerhouse. Rapid industrialization and integration into global trade networks, particularly after joining the WTO in 2001, drove imports from $243.5B in 2001 to $956.1B in 2007.
Despite a slight slowdown during the 2009 financial crisis, imports rebounded, supported by domestic demand and infrastructure investments. The record imports in 2022, followed by a dip to $2.5T in 2023, highlight China’s role in global trade while navigating economic slowdowns and global supply chain adjustments.
Despite a slight slowdown during the 2009 financial crisis, imports rebounded, supported by domestic demand and infrastructure investments. The record imports in 2022, followed by a dip to $2.5T in 2023, highlight China’s role in global trade while navigating economic slowdowns and global supply chain adjustments.
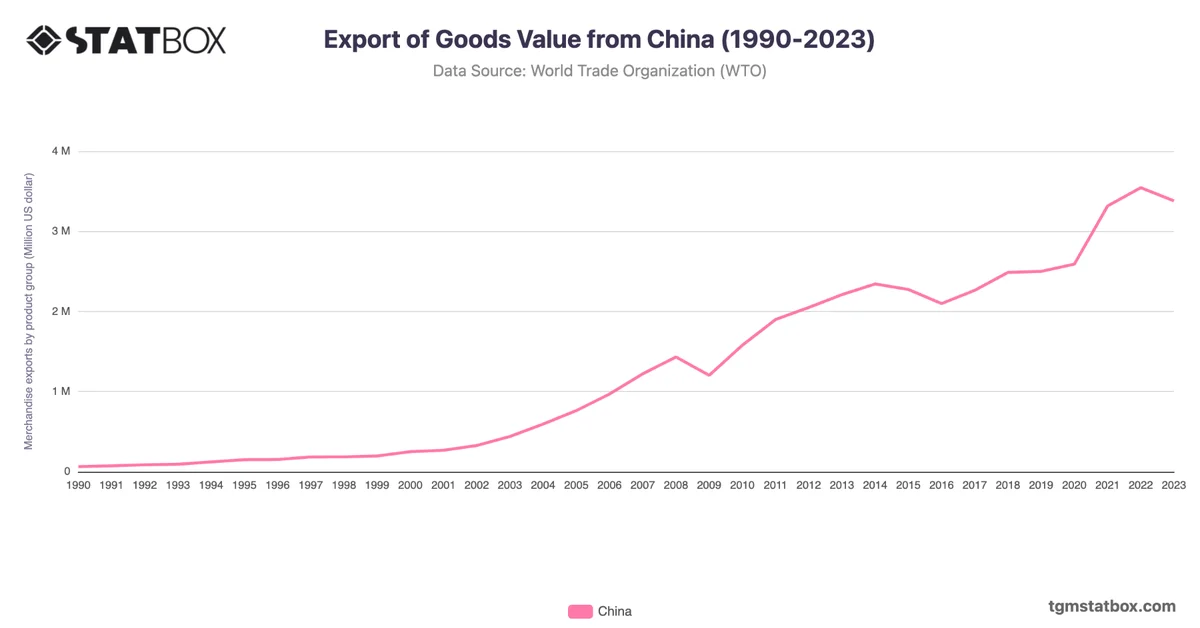
Find out more through related statistics on China’s military spending, China’s exports value, China’s annual GDP growth rate.