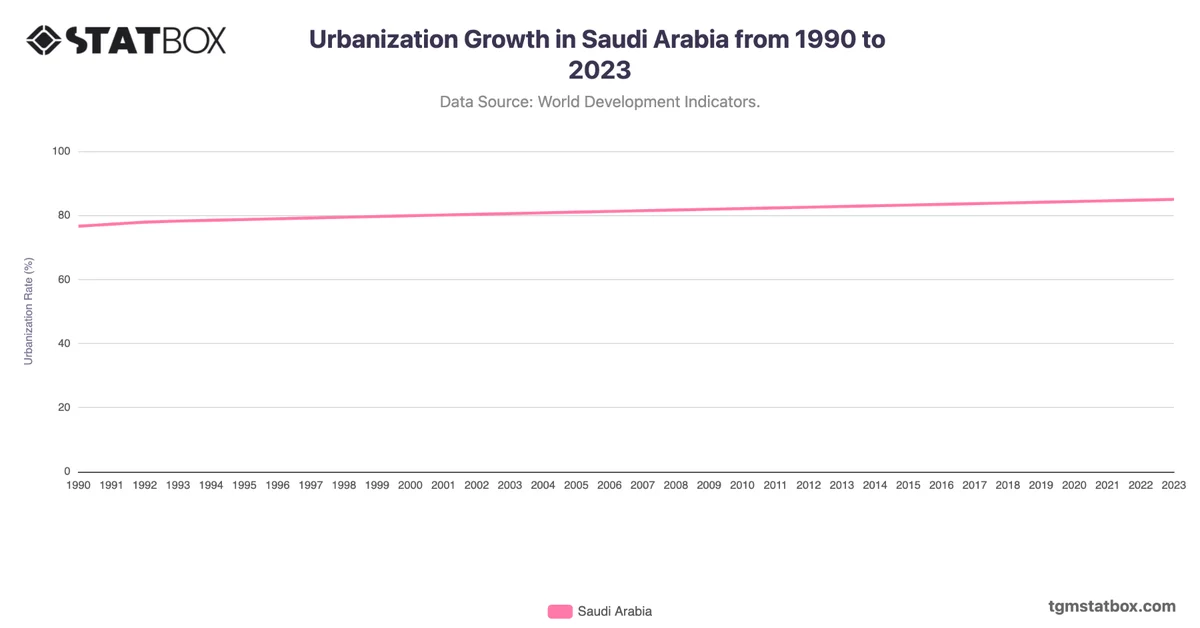
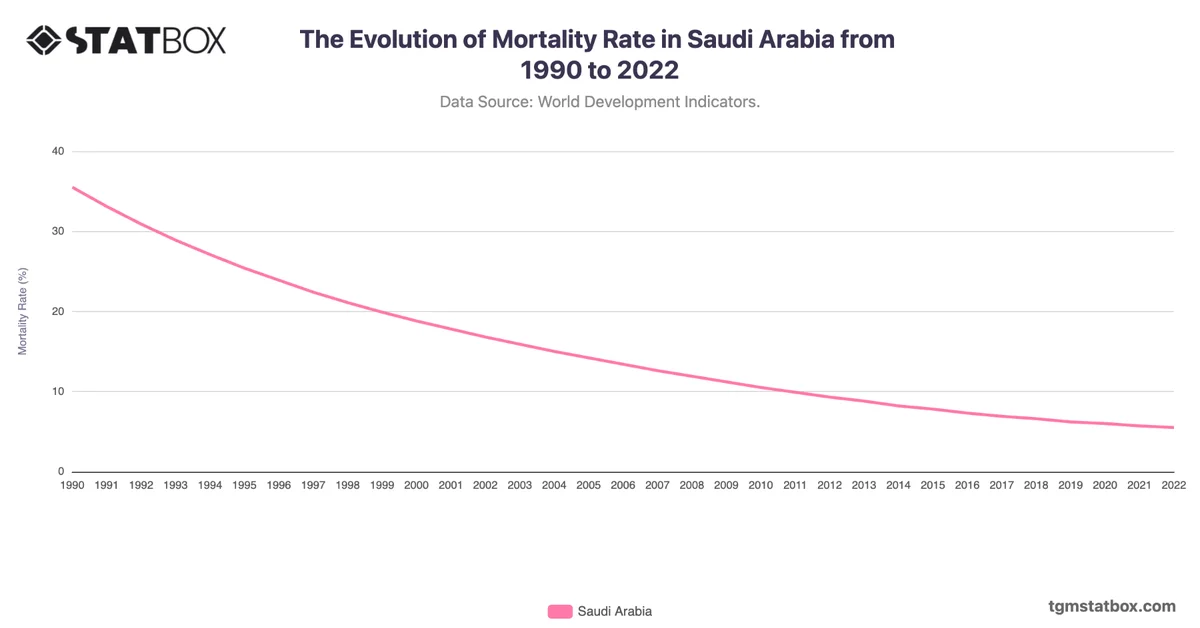
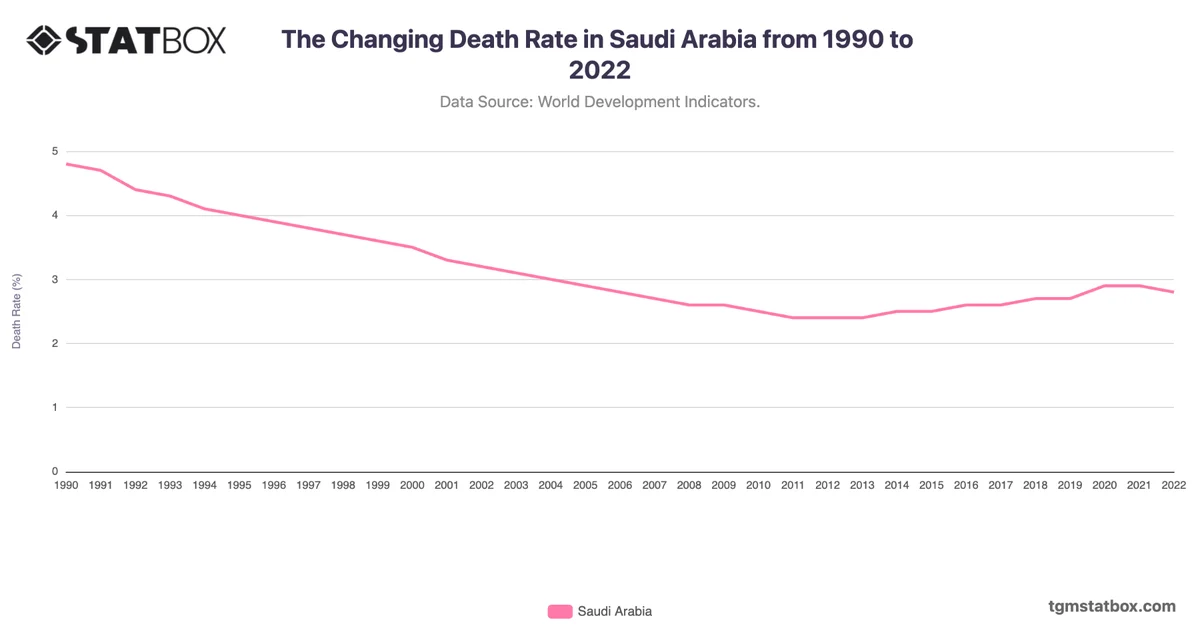
Saudi Arabia’s military personnel as a percentage of the population fluctuated significantly, starting at 0.6% in 1987, then spiking to 1.2% in 1991 due to the Gulf War. This period reflects Saudi Arabia’s regional security concerns and the increased mobilization required to defend against potential threats. Following the Gulf War, the rate stabilized at around 1.0% through the 1990s, aligning with sustained economic growth driven by urbanization, particularly in Riyadh and Jeddah.
As urban centers expanded, Saudi Arabia invested in modernizing its military capabilities while reducing personnel dependency, which led to a gradual decline to 0.8% by 2004. By 2015, the rate further declined to 0.7%, reflecting a strategic shift towards technological advancements and partnerships, especially within the context of urbanized economic development. This adjustment mirrors regional trends, where modernization complements urban growth, supporting a smaller, technologically adept military.
As urban centers expanded, Saudi Arabia invested in modernizing its military capabilities while reducing personnel dependency, which led to a gradual decline to 0.8% by 2004. By 2015, the rate further declined to 0.7%, reflecting a strategic shift towards technological advancements and partnerships, especially within the context of urbanized economic development. This adjustment mirrors regional trends, where modernization complements urban growth, supporting a smaller, technologically adept military.
Gain a broader perspective by reviewing Saudi Arabia’s working-age population trend, saudi arabia’s urbanization expansion, Saudi Arabia’s defense spending.