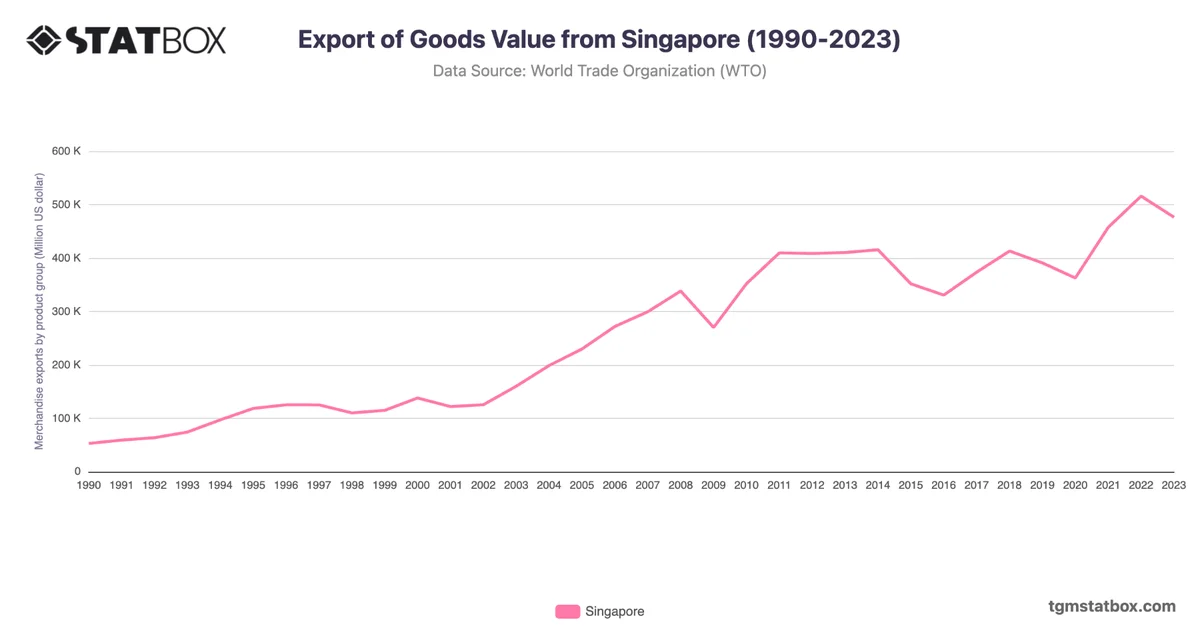
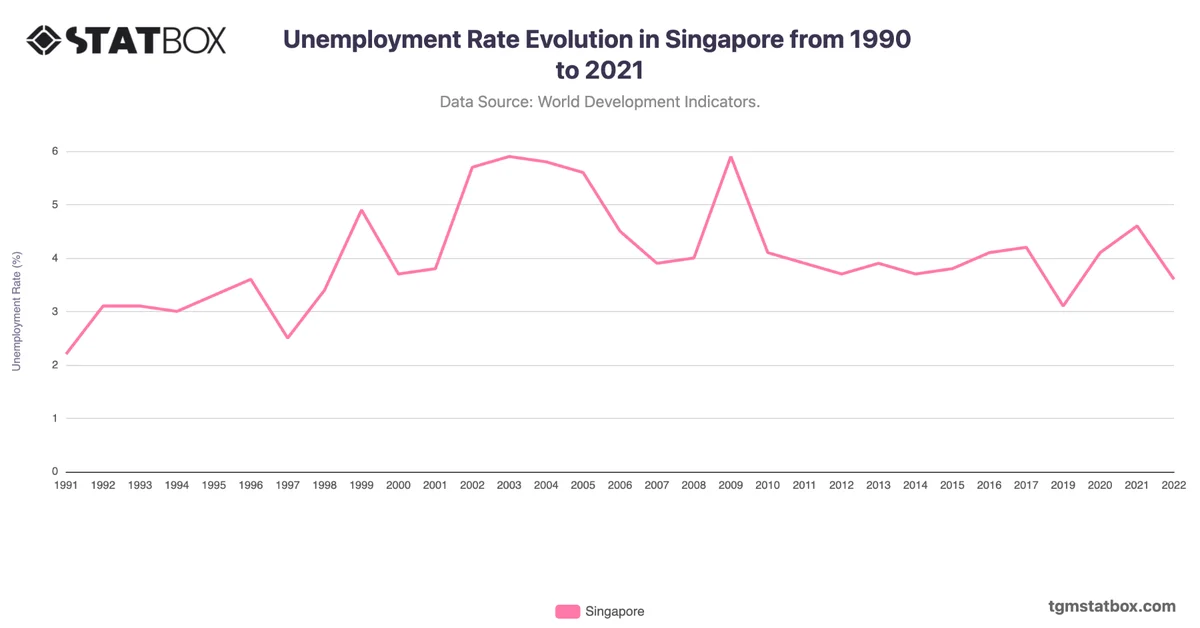
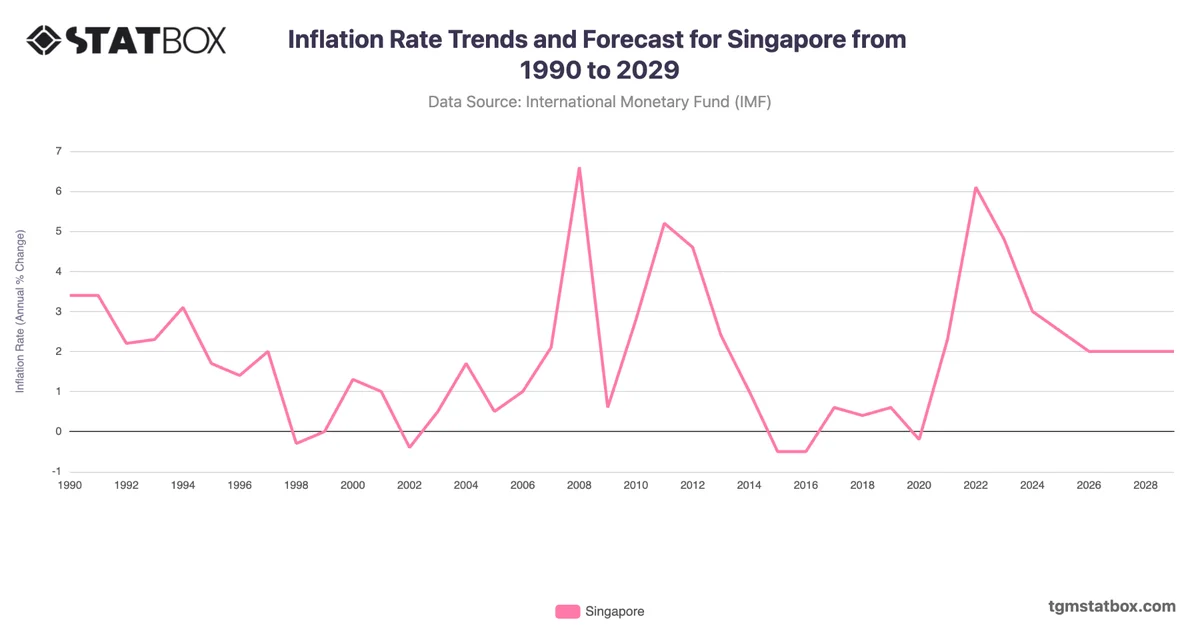
Singapore’s industry sector has played a significant role in its economic development since the 1990s, primarily driven by electronics manufacturing, pharmaceuticals, and petrochemicals. In 1990, the industry sector contributed around 30.9% to GDP, a reflection of Singapore's strategic focus on becoming a manufacturing and logistics hub. The 1990s saw steady growth as Singapore expanded its high-tech manufacturing sector, particularly in semiconductors and biotechnology, with industry contributions peaking around 32.6% in 1991.
Following the 2008 global financial crisis, Singapore’s industry sector faced downward pressure as global demand for exports declined, leading to a shift in focus towards service-driven growth, especially in finance and digital services. By the early 2010s, industry contributions dropped to about 25%, reaching a low of 23.4% in 2013. However, the government’s efforts to maintain a balanced economy led to sustained investment in advanced manufacturing, which includes high-value sectors like pharmaceuticals and precision engineering. Recent data show that industry contributions have stabilized around 24-25%, with a value of 24.2% in 2022. Singapore’s continued emphasis on innovation, research, and high-tech industries within manufacturing reflects its dual strategy of supporting both industrial growth and a robust service economy, positioning it as a leading global financial and technology hub.
Following the 2008 global financial crisis, Singapore’s industry sector faced downward pressure as global demand for exports declined, leading to a shift in focus towards service-driven growth, especially in finance and digital services. By the early 2010s, industry contributions dropped to about 25%, reaching a low of 23.4% in 2013. However, the government’s efforts to maintain a balanced economy led to sustained investment in advanced manufacturing, which includes high-value sectors like pharmaceuticals and precision engineering. Recent data show that industry contributions have stabilized around 24-25%, with a value of 24.2% in 2022. Singapore’s continued emphasis on innovation, research, and high-tech industries within manufacturing reflects its dual strategy of supporting both industrial growth and a robust service economy, positioning it as a leading global financial and technology hub.
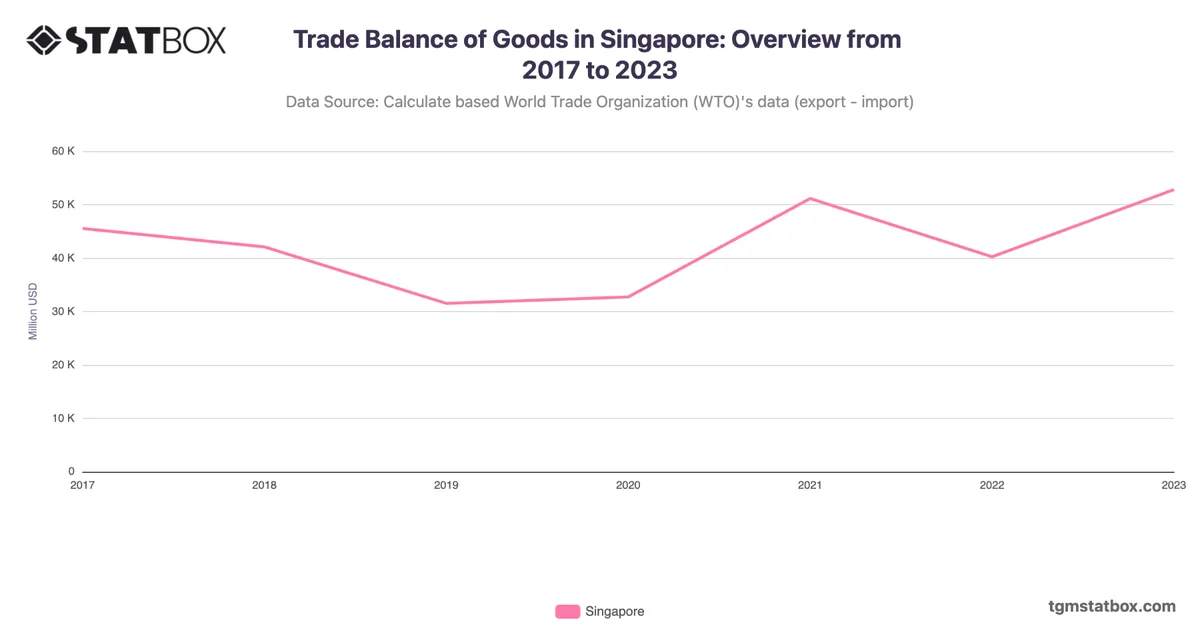
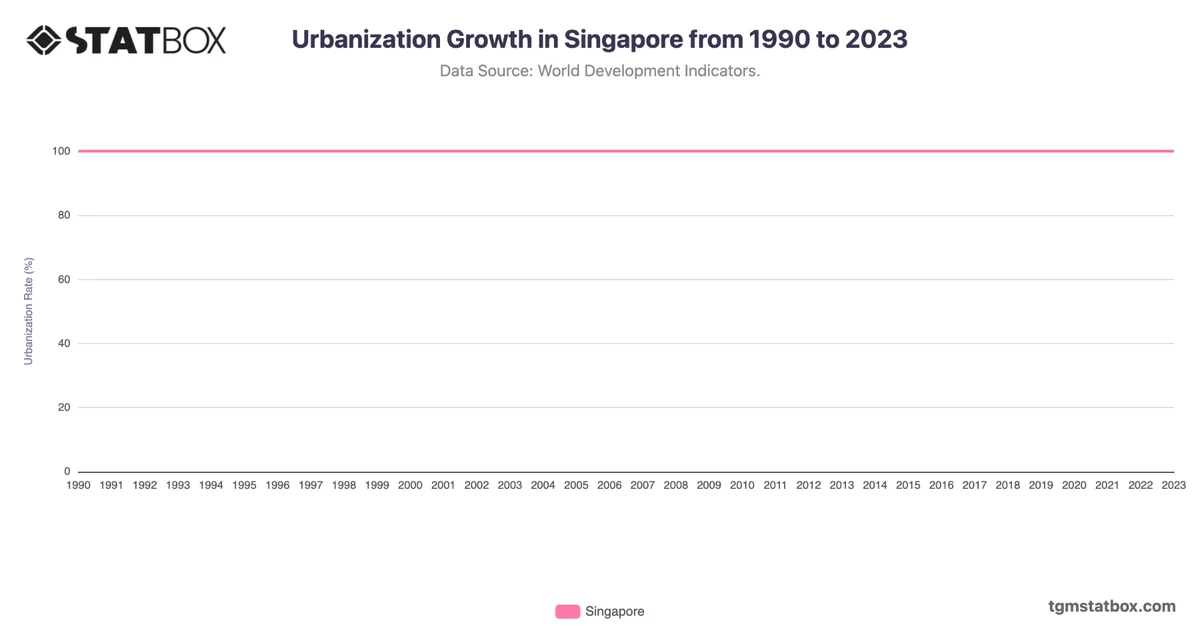
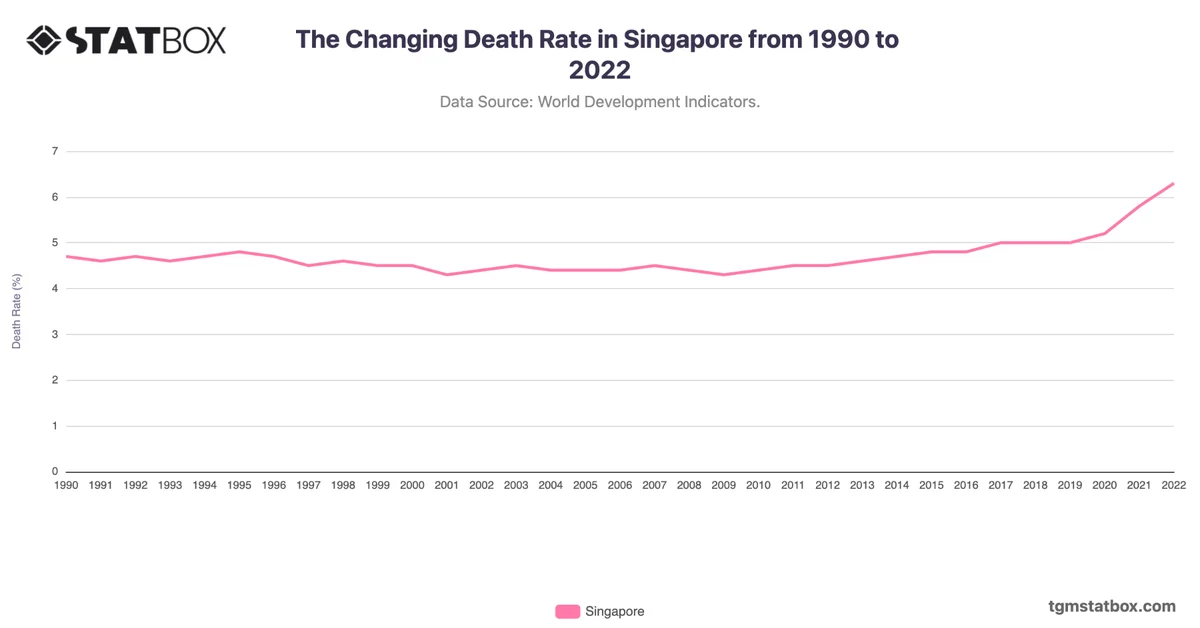
For additional information, visit statistics on Singapore’s urban expansion, Singapore’s goods trade balance, Singapore’s death rate trends.