Charts library
Not sure where to start? Dive into a diverse selection of charts and data visualizations across topics, and find the information you need to drive your research and analysis.
 Pro
Pro
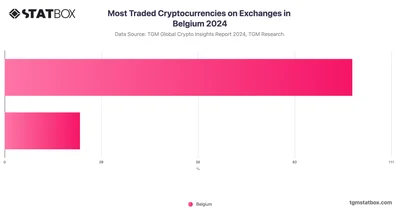
Bitcoin clearly dominates the crypto scene, with around 36% of traders choosing it. Ethereum is the next most popular but sits quite a bit lower at about 8%.
 Pro
Pro
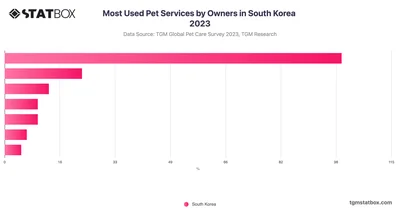
Veterinarian services dominate pet care choices in South Korea, with 61% of respondents utilizing these services, reflecting a strong emphasis on health care for pets.
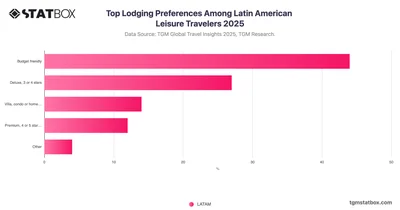
44% of LATAM travelers prioritize budget lodging, while 14% prefer villas or condos—showing a value-driven market with rising interest in group and family-style stays.
 Pro
Pro
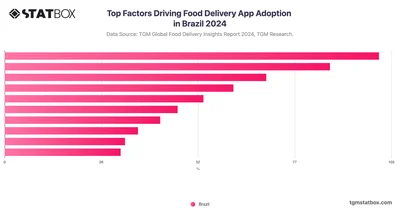
In Brazil, 38.7% of users turn to food delivery apps mainly to avoid cooking, followed by those seeking to satisfy cravings and enjoy added convenience.
 Pro
Pro
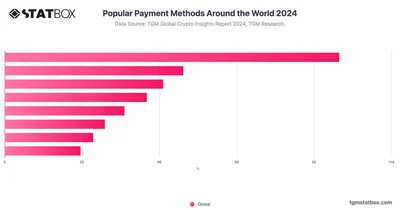
Despite the growing trend of digital payments, cash remains a dominant payment method worldwide, with 43% of people preferring to use cash whenever possible.
 Pro
Pro
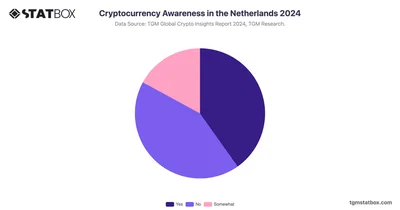
40% of respondents in the Netherlands are familiar with cryptocurrencies, suggesting a solid base of informed individuals open to further crypto engagement.
 Pro
Pro
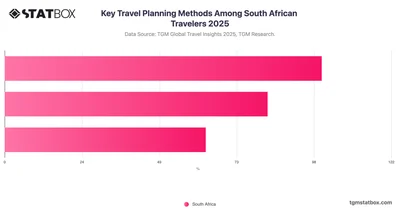
In 2025, South Africans favor hybrid trip planning, balancing digital tools with agency support amid safety and visa concerns. Full data on TGM StatBox.
 Pro
Pro
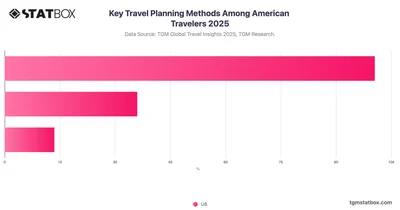
In 2025, most Americans plan trips independently, driven by flexibility, tech tools, and the post-pandemic rise of DIY travel. Full data on TGM StatBox.
 Pro
Pro
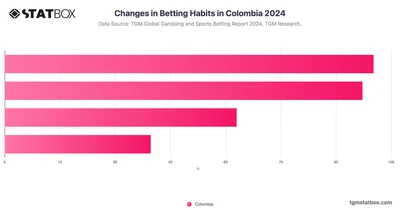
A third of Colombian respondents (33.39%) report betting on sports more frequently in the last 12 months compared to the previous year.
 Pro
Pro
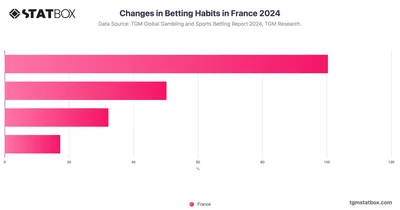
In France, 50.16% of sports bettors report maintaining the same level of betting activity over the past year compared to the previous one.
 Pro
Pro
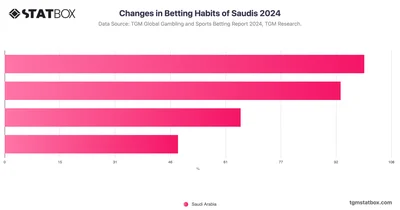
Track how betting habits in Saudi Arabia have changed over time, with data from TGM Statbox highlighting key shifts in consumer behavior.
 Pro
Pro
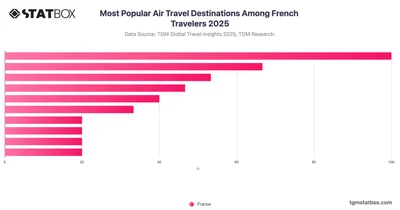
In summer 2025, French travelers are keeping things close to home. The majority are heading to nearby European destinations, Western, Central, and Southern Europe top the list.
 Pro
Pro
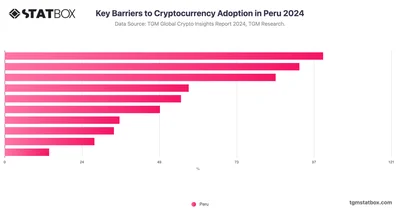
The primary barrier to cryptocurrency adoption in Peru is a lack of understanding, with 41.2% of respondents pointing to this as the biggest challenge.
 Pro
Pro
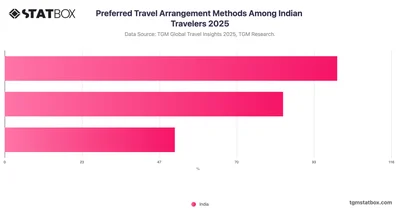
In 2025, 43% of surveyed Indian travelers prefer to plan their trips themselves, using apps and websites to research, compare, and book everything.
 Pro
Pro
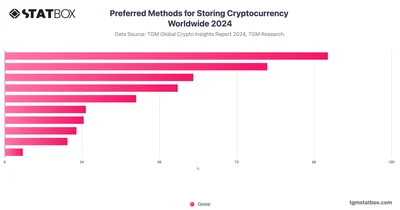
Mobile wallets/apps are the most popular cryptocurrency storage method globally, with 42% of users choosing them for convenience and accessibility.
 Pro
Pro
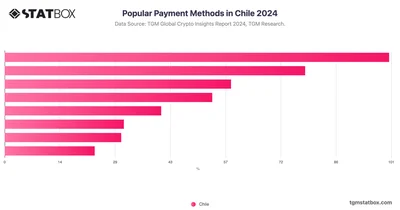
In Chile, cash remains a popular payment method, with about 35% of people saying they pay with cash whenever they can. Digital payments are also on the rise.
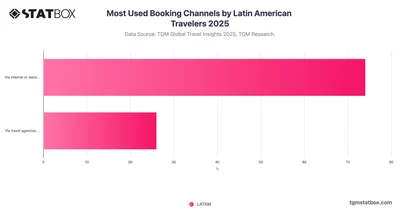
74% of LATAM travelers book trips online, signaling strong digital growth, but 26% still rely on agencies, reflecting the region's blend of tech adoption and personal trust.
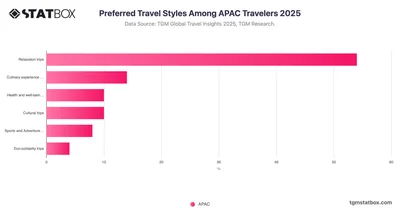
APAC travelers favor relaxation and culinary trips, with a rising interest in wellness and cultural experiences shaped by the region's diverse traditions and emerging trends.
 Pro
Pro
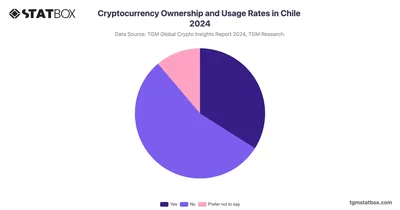
Crypto adoption remains relatively low in Chile, with around 33.9% of respondents having owned or used cryptocurrency, while the majority have never done so.
 Pro
Pro
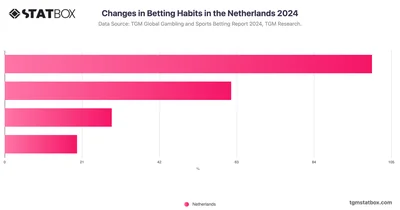
Nearly half of Dutch respondents kept betting steady, 13.85% bet more, 9.36% were first-timers, and many reported betting less in the past year.
 Pro
Pro
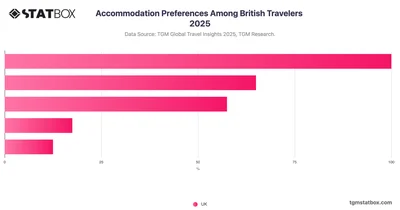
UK travelers favor 3–4-star hotels in 2025, balancing quality with value; vacation rentals lag due to trust issues and urban policy debates. Full data on TGM StatBox.
 Pro
Pro
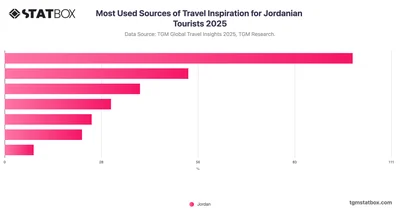
Facebook is the top source of travel inspiration for Jordanians in 2025, reflecting the power of trusted, peer-driven discovery. Full data on TGM StatBox.
 Pro
Pro
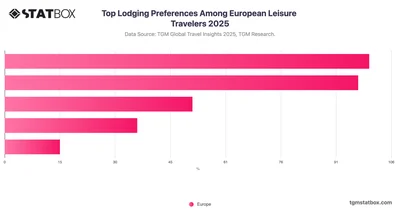
European travelers are practical: 33% choose budget options and 32% opt for deluxe stays, balancing cost and comfort while favoring immersive local lodging.
 Pro
Pro
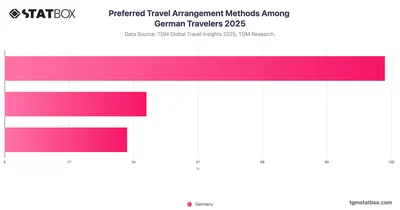
In 2025, German travelers are taking travel planning into their own hands. Nearly 60% prefer to arrange their trips independently, showing a clear shift toward self-reliance.
 Pro
Pro
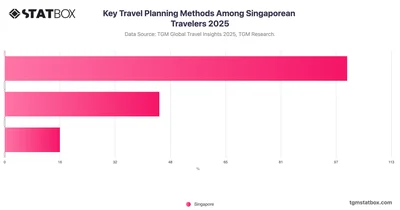
In 2025, 62% of Singaporeans plan trips independently, showing high digital fluency and a national shift toward total travel control. Full data on TGM StatBox.
 Pro
Pro
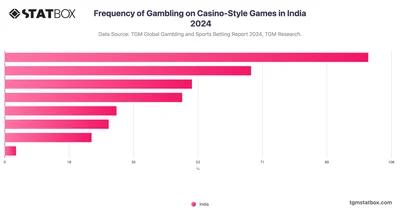
In India, gambling on casino-style games is a moderately frequent activity, with many participating weekly or monthly, while some engage less often or casually.
 Pro
Pro
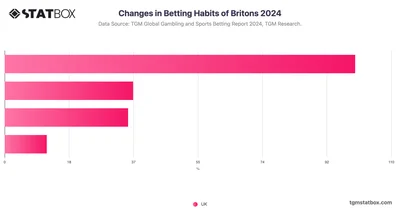
Track changes in betting habits among Britons, focusing on shifts in preferences and activities over time with this TGM Statbox chart.
 Pro
Pro
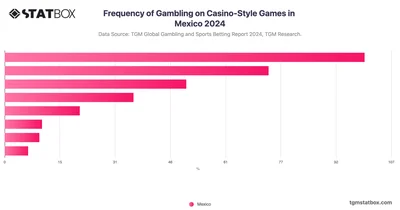
In Mexico, casino-style gambling is relatively popular, with a significant portion of respondents regularly gambling on games like slots, card games, and table games.
 Pro
Pro
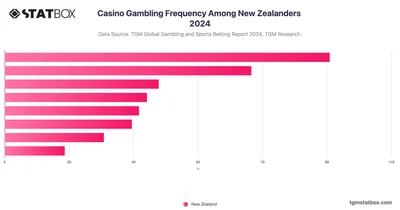
Casino Gambling Frequency Among New Zealanders | TGM Statbox Chart: Examine the frequency of casino gambling among New Zealanders with TGM Statbox's chart.
 Pro
Pro
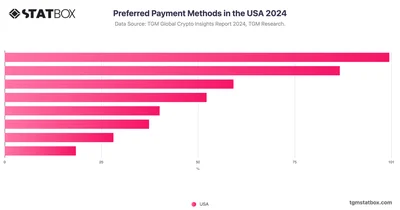
Traditional payment methods still hold strong appeal for many Americans, with a significant portion of the population prefers to pay with cash whenever possible.






