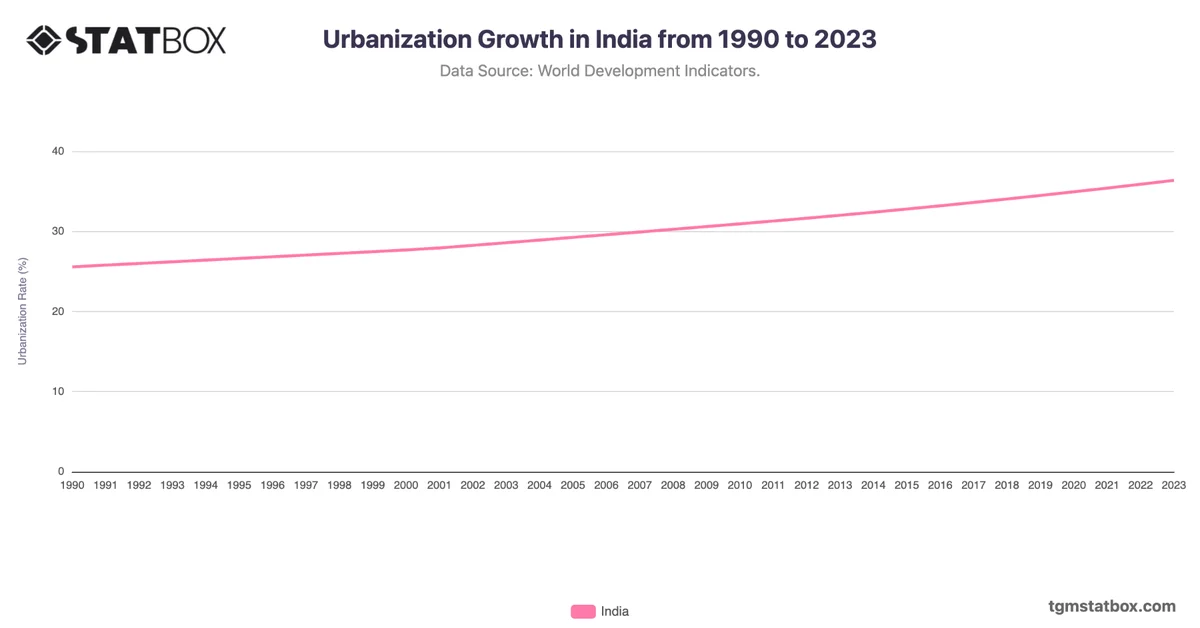
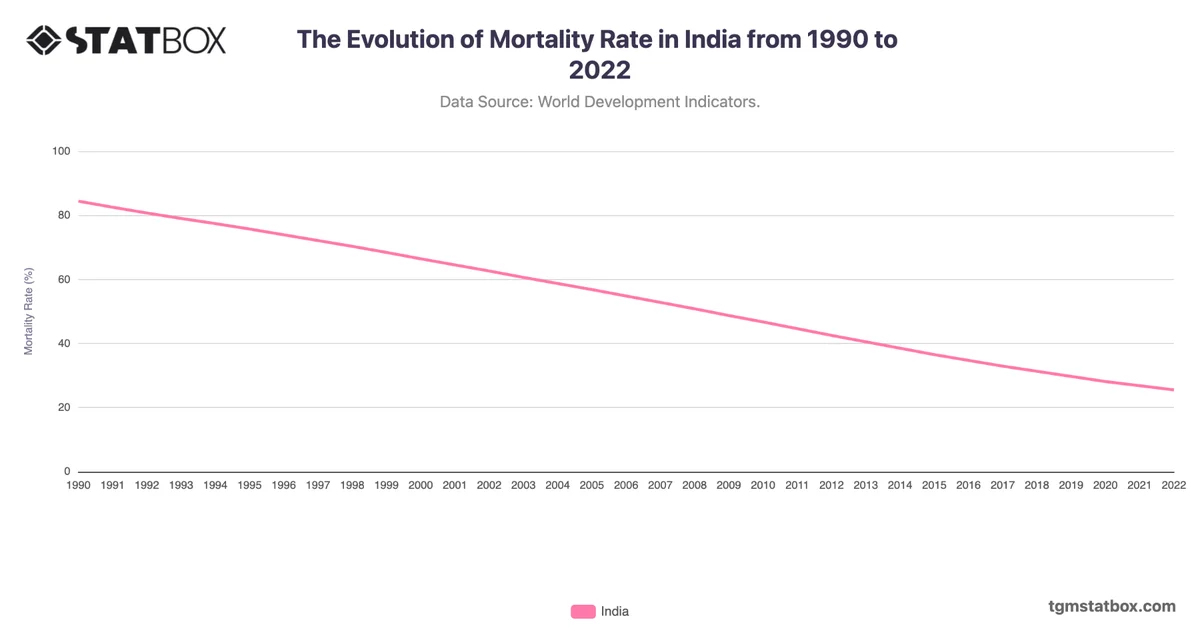
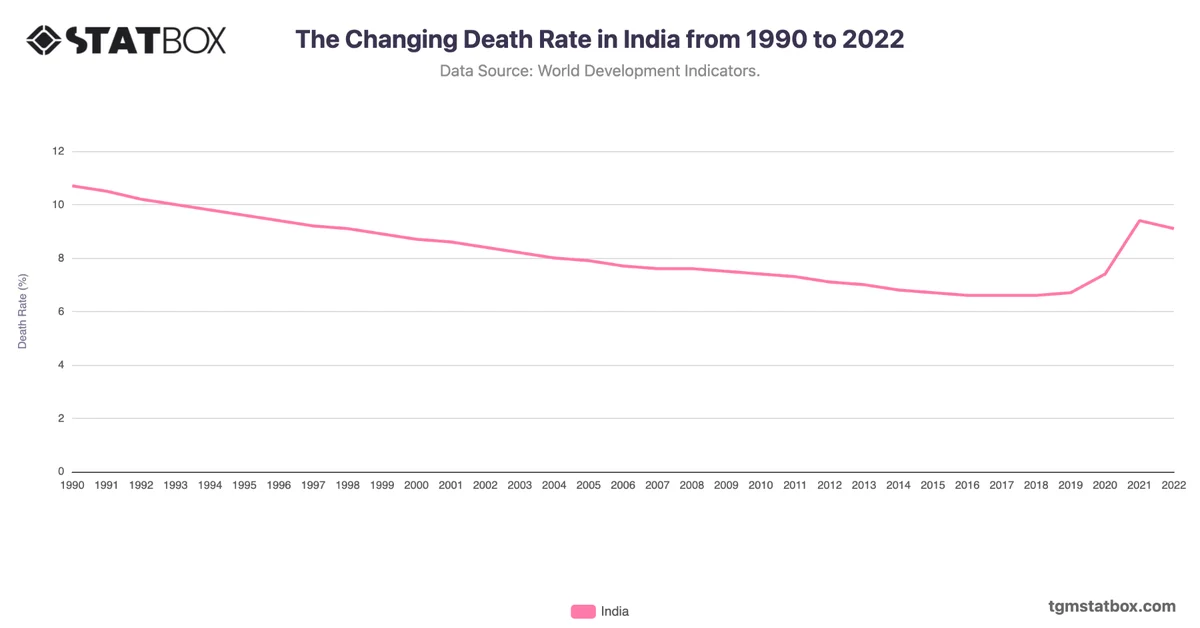
India's median age has steadily increased from 21.2 years in 2000 to a projected 30.8 years by 2030. This gradual rise reflects the country's demographic shift, driven by declining birth rates and improvements in healthcare, which have extended life expectancy. Between 2000 and 2015, the median age rose relatively slowly, from 21.2 to 25.3, as India’s urbanization rate accelerated. With more people moving to urban areas, factors like improved access to education and employment have influenced family planning decisions, contributing to a lower fertility rate and an aging population.
In recent years, the increase in median age has been more pronounced, with the age reaching 28.1 by 2023. As India’s economy expands and more individuals migrate to urban centers, the birth rate continues to decline. This trend is expected to persist, leading to a median age of 30.8 by 2030. The demographic shift in India presents both opportunities and challenges, as the country transitions from a youthful to a more mature age structure, impacting labor force dynamics and long-term economic planning.
In recent years, the increase in median age has been more pronounced, with the age reaching 28.1 by 2023. As India’s economy expands and more individuals migrate to urban centers, the birth rate continues to decline. This trend is expected to persist, leading to a median age of 30.8 by 2030. The demographic shift in India presents both opportunities and challenges, as the country transitions from a youthful to a more mature age structure, impacting labor force dynamics and long-term economic planning.
For additional information, visit statistics on India’s fertility rate trends, India’s birth longevity rate, India’s population density.