Charts library
Not sure where to start? Dive into a diverse selection of charts and data visualizations across topics, and find the information you need to drive your research and analysis.
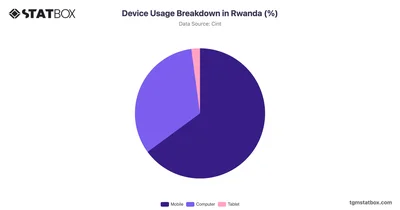
Rwanda exhibits a strong preference for mobile devices, with 64.91% of users relying on them. Discover more about device usage breakdown in Rwanda, on TGM StatBox.
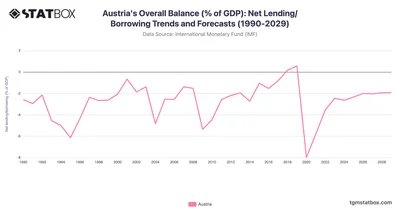
Austria’s fiscal trends show recovery from the pandemic, with stable deficits projected. Discover more statistics and insights on TGM StatBox.
 Pro
Pro
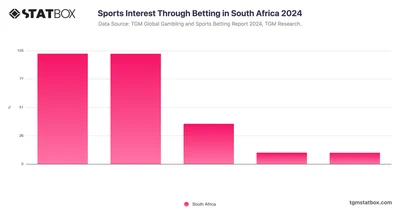
Understand how sports interest is shaped by betting activities in South Africa, showcasing trends in sports betting preferences and engagement.
 Pro
Pro
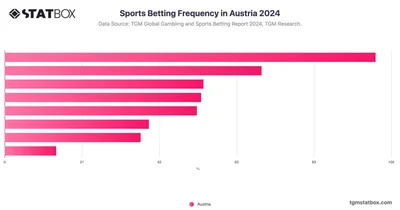
A significant portion of Austrian bettors engage infrequently, with 23.98% placing bets less than once a year and 16.61% betting about once a month.
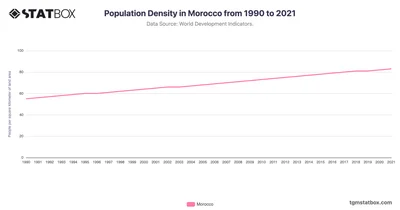
The chart illustrates the steady growth of Morocco's population density, measured as people per square kilometer. Explore the full data on TGM StatBox.
 Pro
Pro
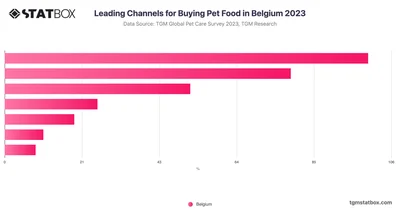
Supermarkets dominate the pet food market in Belgium, with 47% of respondents choosing them as their primary purchasing channel. Pet owners seek convenience when buying pet food.
 Pro
Pro
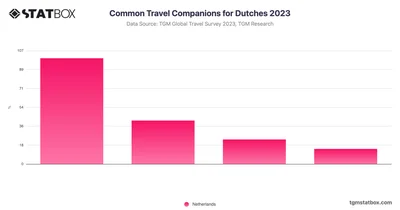
In Switzerland, family is the most popular travel companion for Dutch citizens, with 56% traveling with family members, while 23% prefer to travel solely with their partners.
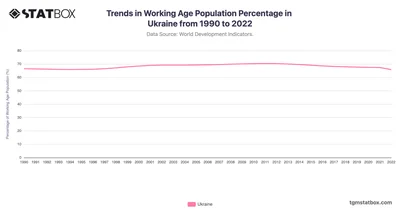
Ukraine's working-age population percentage began declining after 2013, dropping to 65.8% in 2022. Discover the complete data on TGM StatBox.
 Pro
Pro
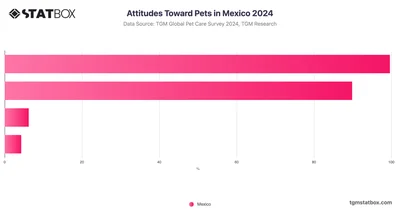
In Mexico, 44.93% of people like all pets, while a slightly larger proportion, 49.82%, prefer specific types, resulting in a fairly even split in preferences.
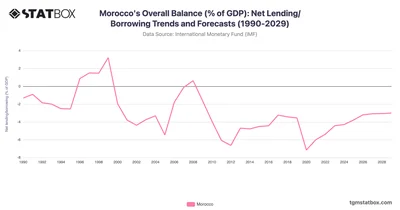
Morocco’s fiscal journey includes deficits tied to public spending, with ongoing reforms shaping stability. Discover more statistics and insights on TGM StatBox.
 Pro
Pro
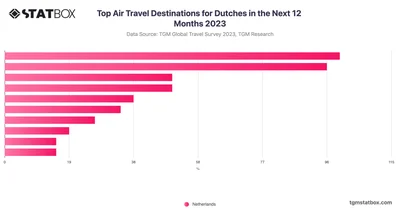
Southern Europe and the Balkans are appealing to 26% of Dutch travelers. This region surpasses other European areas in popularity.
 Pro
Pro
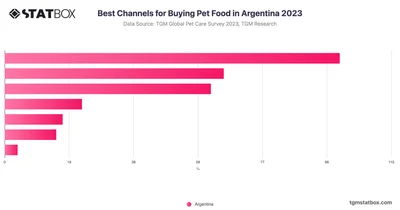
In Argentina, 52% of pet owners prefer independent pet stores or small pet chains for purchasing pet food. Convenience stores are also a popular choice.
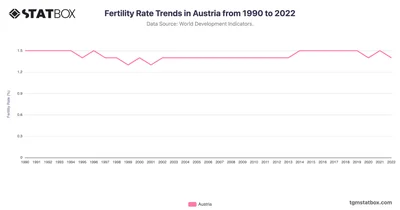
Discover Austria's fertility trends from 1990 to 2022, unveiling population changes shaped by modern developments. Discover more statistics and insights on TGM StatBox.
 Pro
Pro
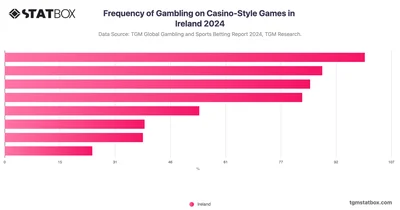
In Ireland, a smaller percentage, 7.51%, gamble every day, while 16.59% engage in such activities a few times a week and 16.16% once a week.
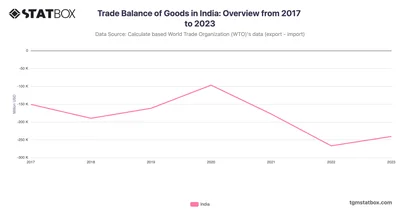
India’s trade deficit narrowed slightly in 2023 despite high import demand and limited export diversification. Discover more statistics and insights on TGM StatBox.
 Pro
Pro
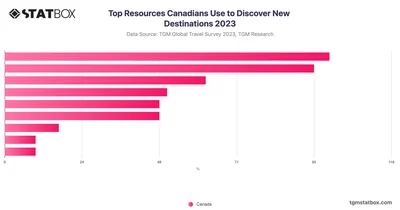
Websites of travel companies remain the primary source for Canadian travelers, with 41.8% turning to these platforms for discovering new destinations.
 Pro
Pro
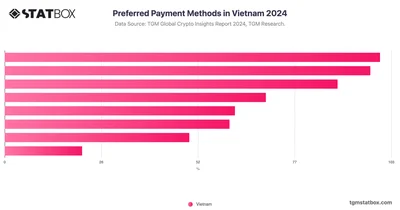
While cash remains preferred in Vietnam, nearly 39% store credit card info on phones, signaling a shift towards mobile and digital payments.
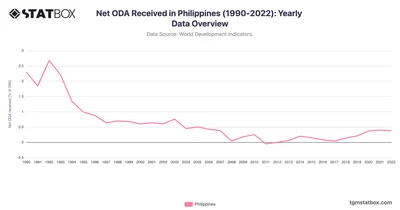
The Philippines’ Net ODA peaked at 2.7% in 1992, stabilizing below 1% post-2000. Discover more statistics and insights on TGM StatBox.
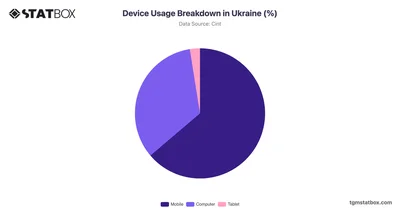
Discover the detailed breakdown of device usage in Ukraine, with percentage insights into the prevalence of smartphones, tablets, and desktops in daily life.
 Pro
Pro
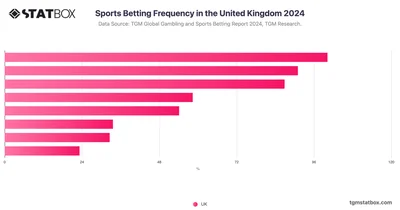
Discover how frequently Britons engage in sports betting, offering insights into their betting habits and trends with this TGM Statbox chart.
 Pro
Pro
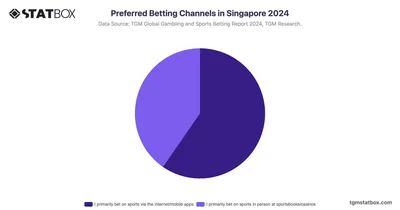
Explore the preferred betting channels used by Singaporeans, from online platforms to physical venues, through this detailed TGM Statbox chart.
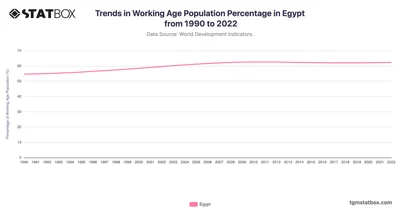
Egypt's working-age population increased from 54.6% in 1990 to 62.3% in 2022. Discover the complete data on Egypt's working-age population on TGM StatBox.
 Pro
Pro
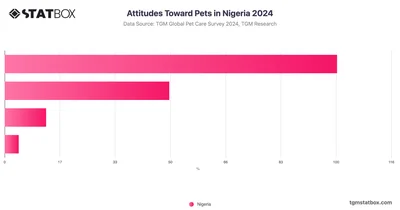
The majority of Nigerians (60.17%) express a preference for specific pets, significantly higher than the global average. Indifference towards pets is relatively low at 2.54%.
 Pro
Pro
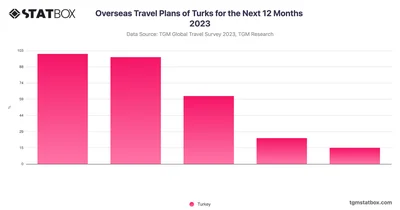
66.44% of Turkish respondents express likelihood to travel abroad. This figure aligns closely with global trends, slightly lower than the UAE and Saudi Arabia.
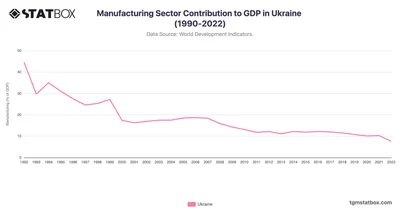
In Ukraine, the manufacturing sector’s GDP share peaked in the early 1990s, starting at 44.6% in 1992. See more Ukraine’s GDP data over the decades on TGM StatBox.
 Pro
Pro
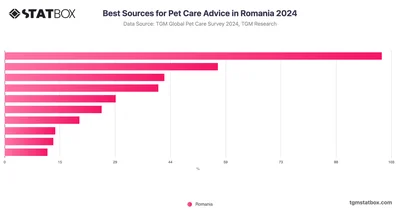
Veterinarians are the most trusted source of pet care information in Romania, with 68.28% of pet owners consulting them for advice.
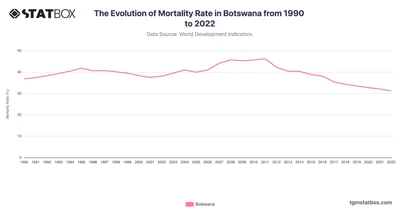
Botswana's mortality rate fluctuated before steadily declining from 72.8 in 2005 to 56.4 in 2022, reflecting health improvements post-HIV epidemic. Discover more on TGM StatBox.
 Pro
Pro
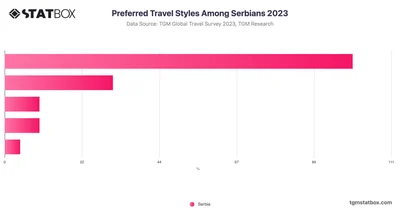
The travel preferences of Serbian citizens reveal a strong inclination towards relaxation and discovery trips, with an impressive 90.03% of respondents favoring this style.
 Pro
Pro
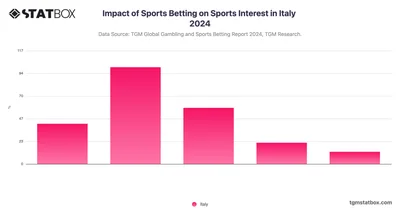
In Italy, over 60% say sports betting boosts their interest in sports, adding excitement, while 14.8% feel it doesn’t enhance their engagement.
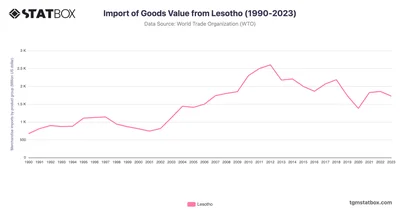
Lesotho’s imports grew modestly from $672M in 1990 to $1.7B in 2023, with peaks in infrastructure and textile inputs. Discover more statistics and insights on TGM StatBox.






