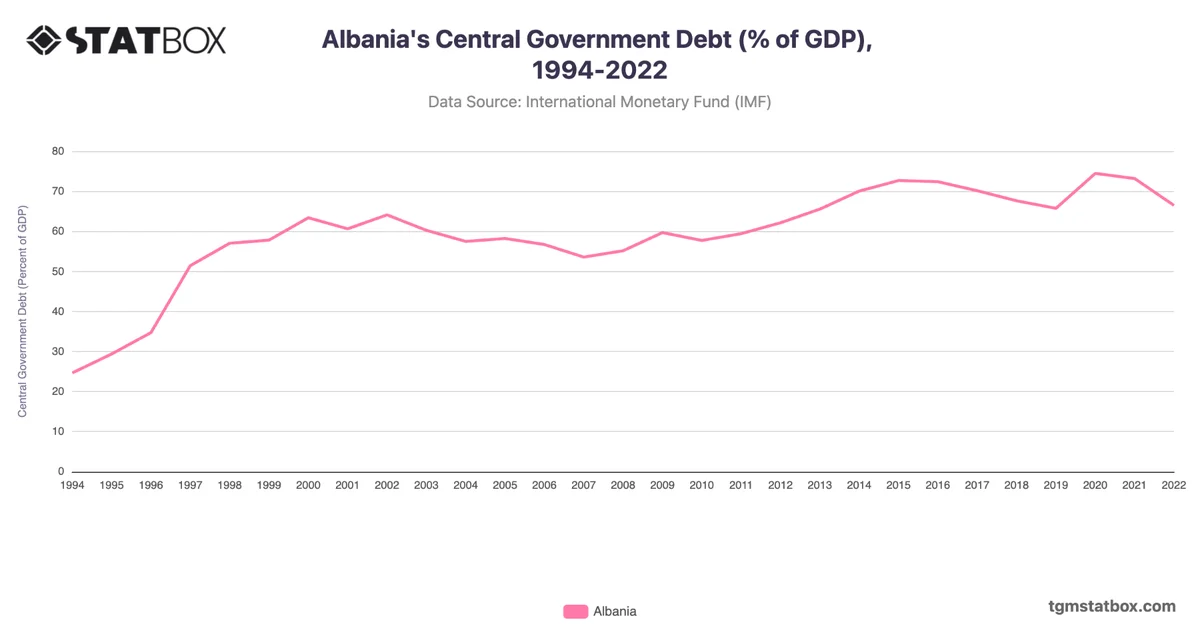
Albania’s general government debt surged from the mid-1990s, rising from 24.6% of GDP in 1994 to over 50% by 1997, driven primarily by economic instability and the collapse of numerous pyramid schemes that deeply impacted the country’s finances. This period marked a dramatic increase in debt, as Albania sought international aid to stabilize its economy. Debt levels remained elevated, peaking in the early 2000s at 64.1% in 2002, reflecting the country's efforts to invest in economic restructuring and public sector reform.
From 2004 onward, Albania made strides to stabilize its debt-to-GDP ratio, with debt hovering around 55-60% until 2012. However, by 2013, debt levels increased significantly to 70.4%, as government spending intensified to address infrastructure needs and economic reforms. The COVID-19 pandemic in 2020 pushed debt to a peak of 75.9%, reflecting the economic downturn and increased government spending on health and social programs. Albania’s debt declined post-pandemic, reaching 67.6% by 2022, as the economy gradually recovered.
From 2004 onward, Albania made strides to stabilize its debt-to-GDP ratio, with debt hovering around 55-60% until 2012. However, by 2013, debt levels increased significantly to 70.4%, as government spending intensified to address infrastructure needs and economic reforms. The COVID-19 pandemic in 2020 pushed debt to a peak of 75.9%, reflecting the economic downturn and increased government spending on health and social programs. Albania’s debt declined post-pandemic, reaching 67.6% by 2022, as the economy gradually recovered.
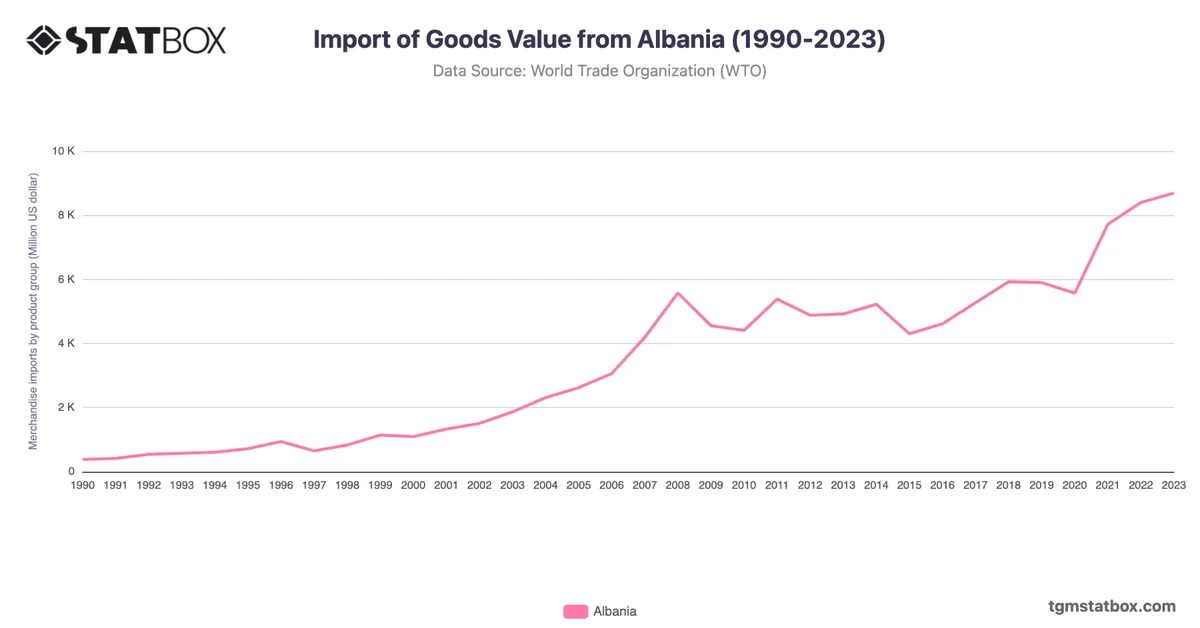
For a deeper dive into the topic, explore Albania’s goods import value, Albania’s net ODA received, Albania’s military spending.