Botswana's Net ODA as a percentage of GNI shows a significant decline over the observed period, reflecting its transition from aid dependency to becoming a middle-income country. In 1990, Net ODA stood at 3.9%, but by the early 2000s, it had fallen to below 1%, indicating successful economic growth driven by prudent governance and effective utilization of diamond revenues. A notable spike occurred in 2008, with ODA reaching 7.1%, likely tied to donor support for mitigating the global financial crisis's impact on Botswana's economy.
From 2010 onwards, ODA contributions stabilized at around 0.5%, reflecting Botswana's reduced need for external assistance. This steady low level highlights the country’s ability to finance its development through domestic resources, although occasional fluctuations suggest continued donor engagement in health, education, and climate-related initiatives.
From 2010 onwards, ODA contributions stabilized at around 0.5%, reflecting Botswana's reduced need for external assistance. This steady low level highlights the country’s ability to finance its development through domestic resources, although occasional fluctuations suggest continued donor engagement in health, education, and climate-related initiatives.
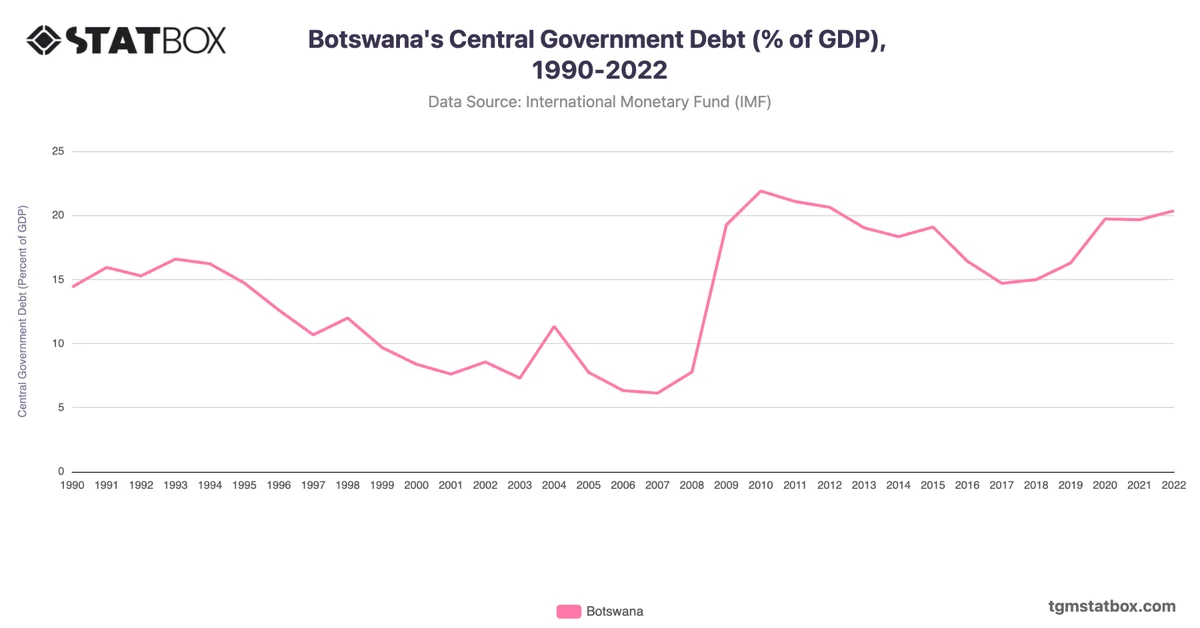
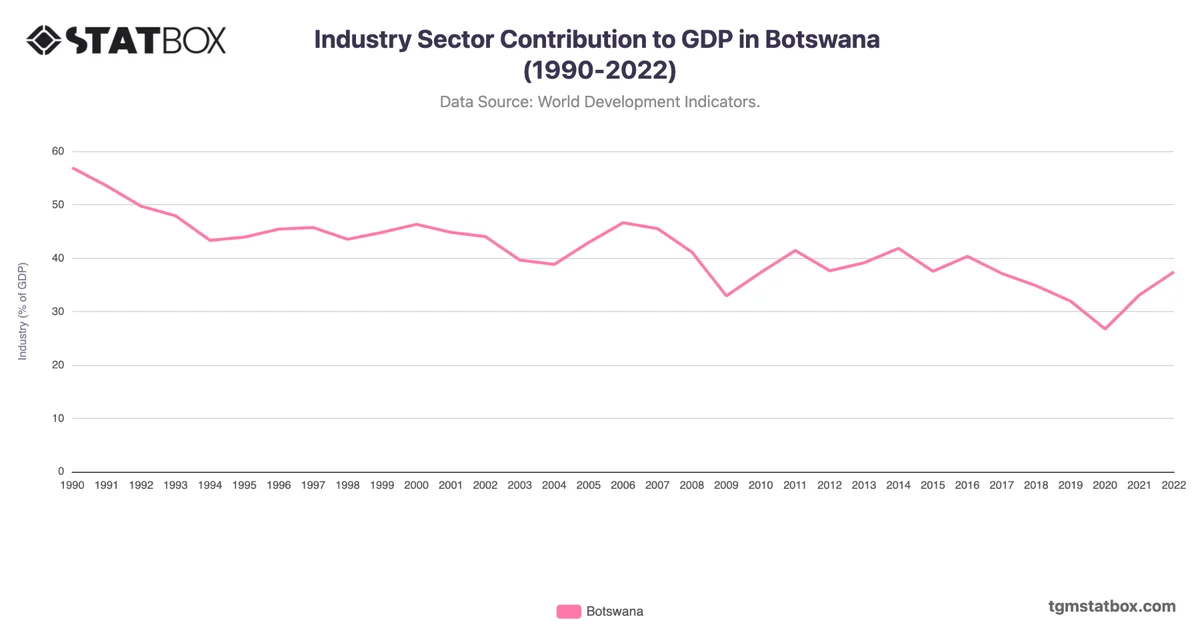
Gain a broader perspective by reviewing Botswana’s population growth trend, Botswana’s central government debt to GDP ratio, Botswana’s industry sector GDP share.