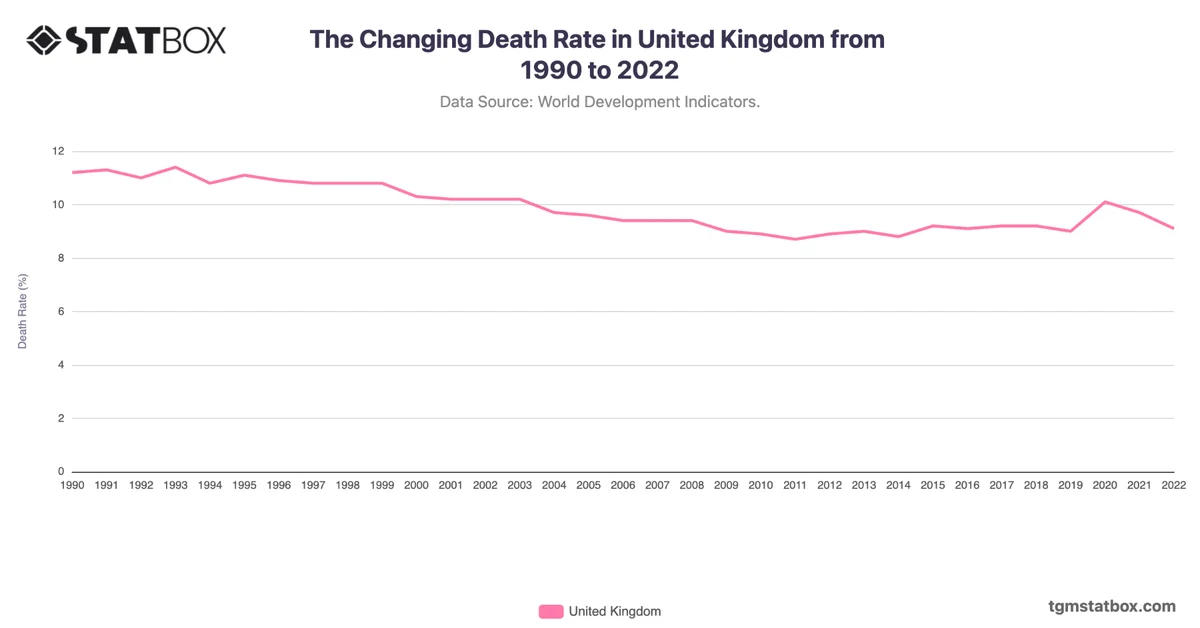
The United Kingdom's mortality rate declined from 7.9 in 1990 to 3.6 in 2022, reflecting consistent improvements in healthcare access and quality. By 2000, the rate had fallen to 5.6, driven by advancements in neonatal care and public health initiatives targeting smoking cessation and vaccination.
Between 2000 and 2022, the decline continued steadily, with the rate reaching 3.6 in 2021. These gains underscore the impact of the National Health Service (NHS) in reducing preventable deaths and managing chronic illnesses. However, pressures on the NHS and an aging population present ongoing challenges.
Between 2000 and 2022, the decline continued steadily, with the rate reaching 3.6 in 2021. These gains underscore the impact of the National Health Service (NHS) in reducing preventable deaths and managing chronic illnesses. However, pressures on the NHS and an aging population present ongoing challenges.
Gain a broader perspective by reviewing United Kingdom’s mortality rate trend, UK’s military presence estimate, Urbanization trends in the UK.