Argentina's unemployment rate exhibited notable fluctuations from 1990 to 2021, reflecting the nation's turbulent economic landscape. In the early 1990s, Argentina's unemployment was relatively low, starting at 7.1% in 1990. This period was characterized by attempts to stabilize the economy after the hyperinflation of the late 1980s, which initially seemed promising. However, the mid-1990s brought about a significant rise in unemployment, reaching 18.8% in 1995. This increase was largely due to economic stagnation and a series of financial crises that deeply affected job availability.
Entering the 2000s, the unemployment rate gradually declined as the government implemented various economic reforms. Despite a brief spike during the 2001–2002 crisis, when unemployment climbed to 19.6%, the economy began to stabilize, and unemployment rates trended downward, reaching 7.2% by 2011. The following years showed stability, with only minor fluctuations, indicating a recovery phase. However, recent economic challenges pushed the unemployment rate up again, peaking at 11.5% in 2020 during the COVID-19 pandemic, before showing signs of recovery in 2021.
Entering the 2000s, the unemployment rate gradually declined as the government implemented various economic reforms. Despite a brief spike during the 2001–2002 crisis, when unemployment climbed to 19.6%, the economy began to stabilize, and unemployment rates trended downward, reaching 7.2% by 2011. The following years showed stability, with only minor fluctuations, indicating a recovery phase. However, recent economic challenges pushed the unemployment rate up again, peaking at 11.5% in 2020 during the COVID-19 pandemic, before showing signs of recovery in 2021.
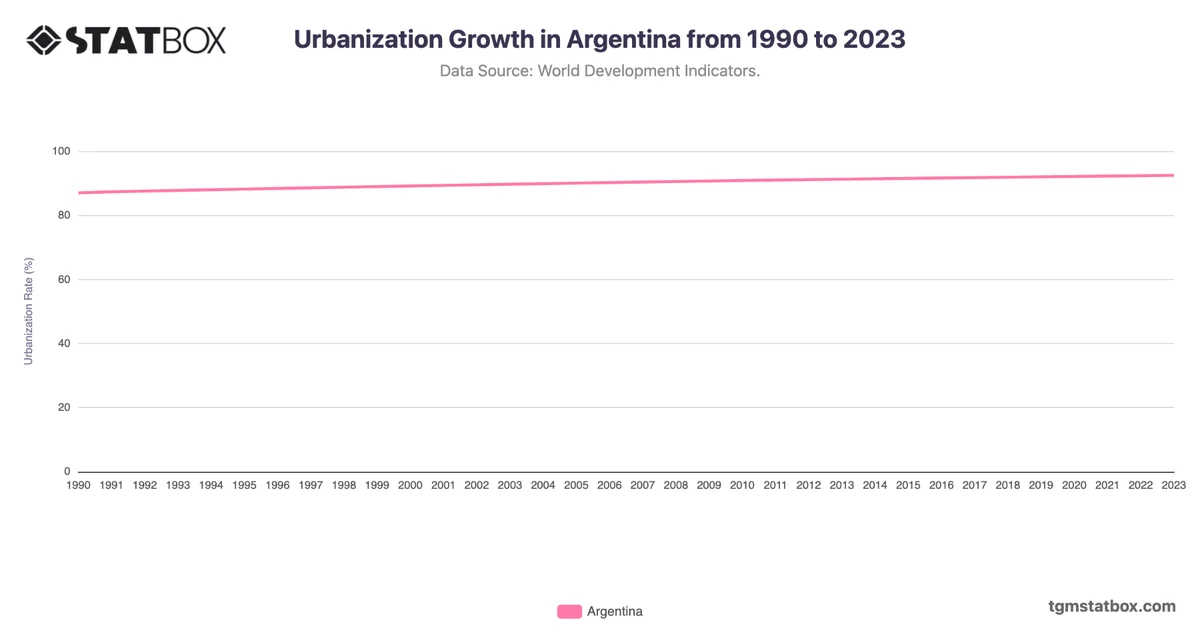
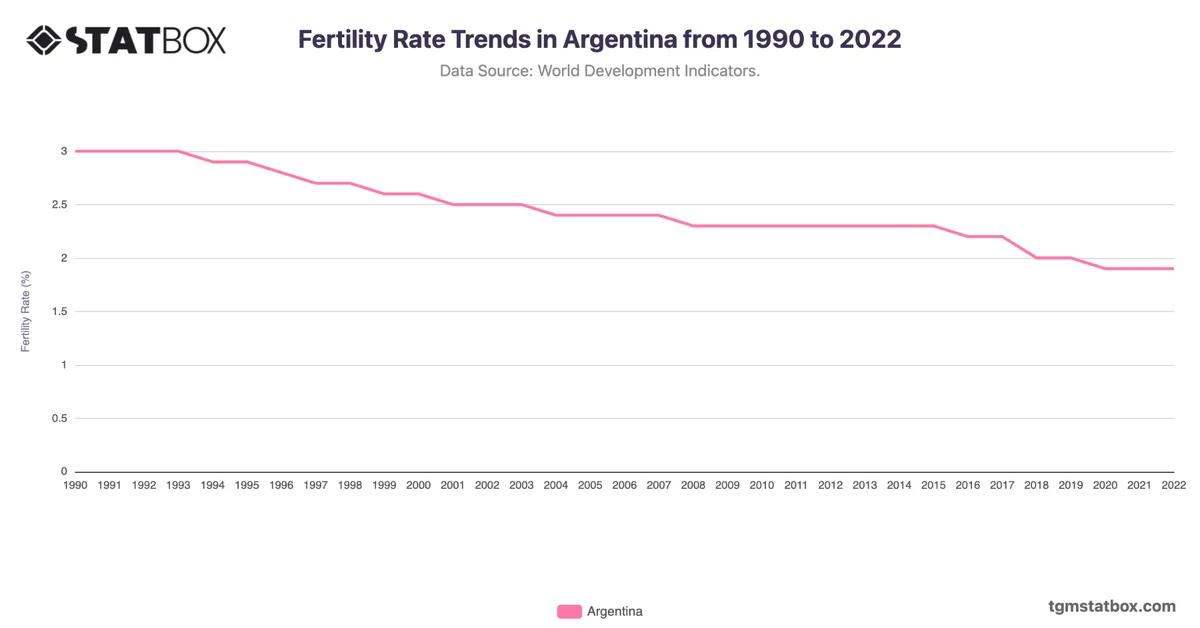
For a deeper dive into the topic, explore Argentina’s fertility rate trends, Argentina’s population figures, Argentina’s urbanization rate.