New Zealand’s military personnel as a percentage of its population declined steadily from 1987 to 2016. Starting at 0.4% in 1987, the percentage decreased to 0.2% by the early 2000s and remained stable through 2016. This gradual decline reflects broader social and economic changes, including a shift towards a smaller, more specialized military force and the country’s focus on regional peacekeeping rather than large-scale military engagement. The reduction in military personnel also aligns with New Zealand’s strong emphasis on non-nuclear policies and defense realignment, reducing the need for a large standing military.
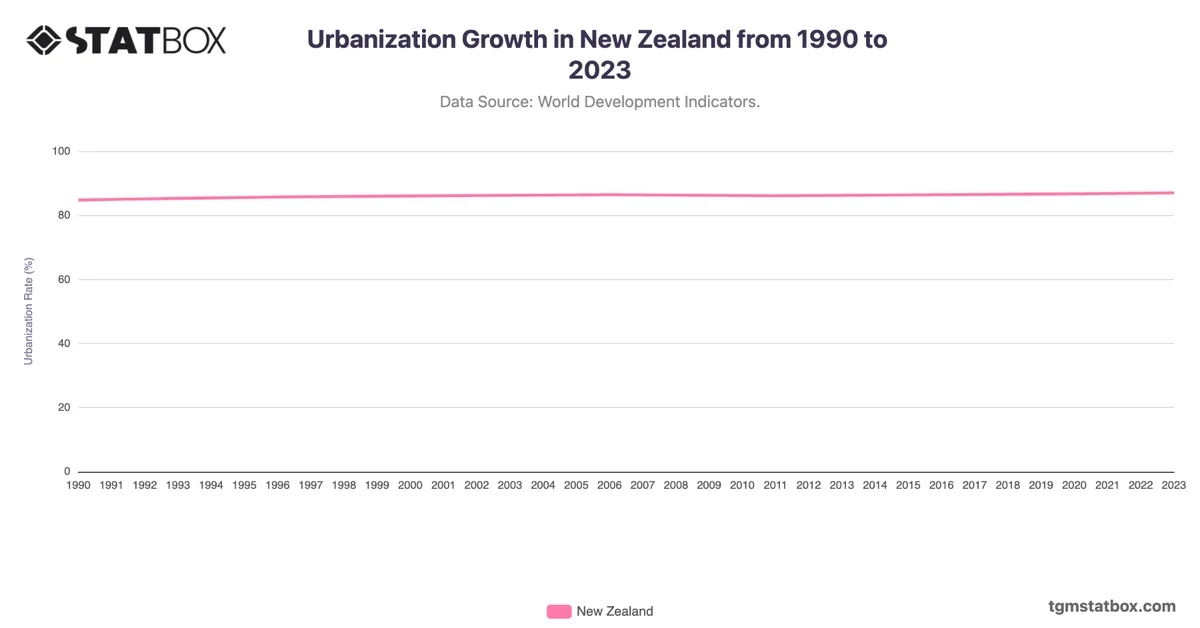
Urbanization and demographic shifts further influenced this trend. New Zealand’s urban population steadily increased during this period, with more resources directed toward urban infrastructure and social services rather than military expansion. The stable 0.2% seen from the early 2000s onward represents New Zealand’s balance between maintaining a modest defense force and focusing on diplomatic and economic initiatives to ensure national security and stability.
Urbanization and demographic shifts further influenced this trend. New Zealand’s urban population steadily increased during this period, with more resources directed toward urban infrastructure and social services rather than military expansion. The stable 0.2% seen from the early 2000s onward represents New Zealand’s balance between maintaining a modest defense force and focusing on diplomatic and economic initiatives to ensure national security and stability.
For a deeper dive into the topic, explore New Zealand’s working age population ratio, New Zealand’s median age evolution, New Zealand’s population numbers.