Gender Symmetry in Pet Attitudes Across Asia Pacific
Consumer attitudes toward pets carry meaningful implications for product development, retail strategy, and service design across the Asia Pacific region. Pet ownership and engagement span a wide spectrum of emotional relationships, from deep affection to indifference or aversion, making it important to understand how attitudes are distributed across demographic groups such as gender.
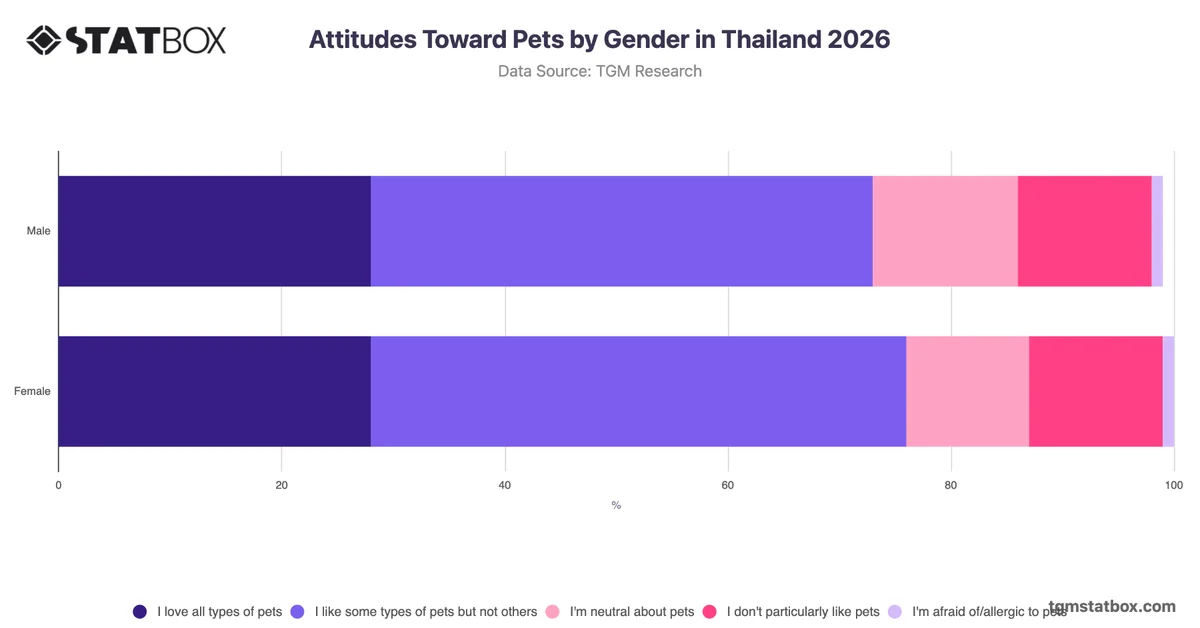
The most notable pattern across Asia Pacific is the near-identical distribution of pet attitudes between male and female consumers, with differences of no more than two percentage points across all five response categories. Conditional acceptance, defined as liking some pets but not others, is the dominant position for both groups, at 45% among males and 43% among females. Unconditional affection accounts for 27% in both groups, while outright dislike and aversion remain marginal. This consistency suggests that gender is a weak differentiator in pet attitude segmentation across the region. For organisations developing pet-related products or communications, this points to limited commercial value in gender-targeted messaging. Segmentation strategies may be better directed toward attitude depth, specifically distinguishing conditional from unconditional pet affinity, as the gap between those two positions is more commercially meaningful than any gender-based contrast in the data.