Gender Symmetry in Pet Attachment Attitudes in Indonesia
The role of pets in personal and social life carries meaningful implications for consumer identity, household decision-making, and lifestyle values. In Indonesia, attitudes toward pets intersect with questions of companionship, responsibility, and the boundaries between private and communal life, making gender a relevant lens for understanding how these values are distributed across the population.
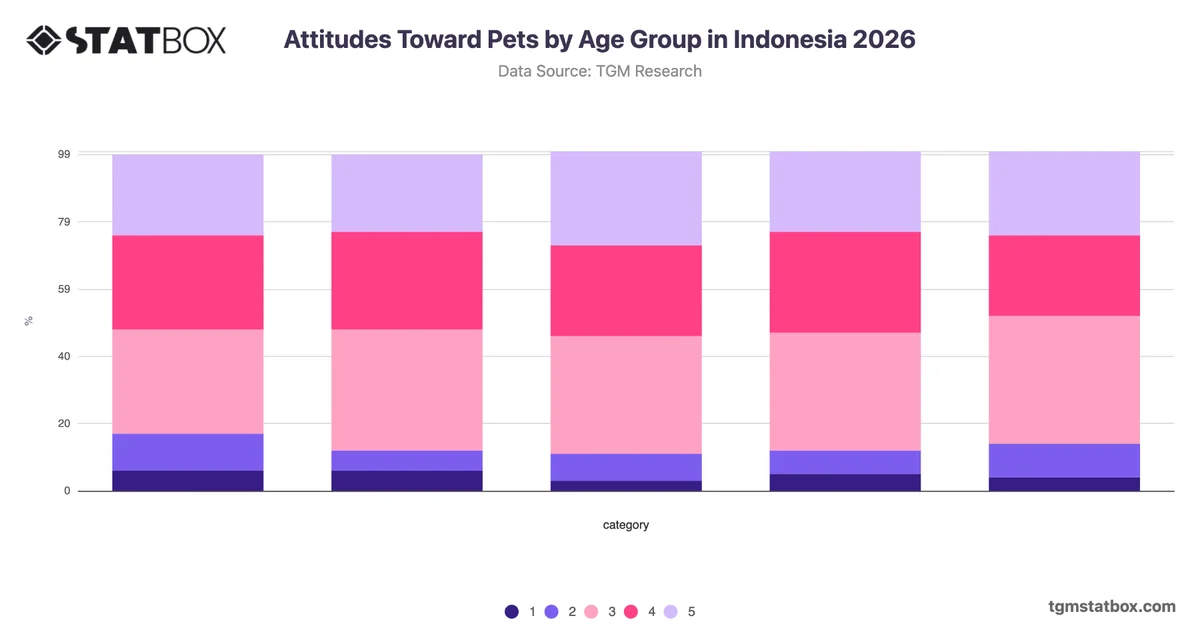
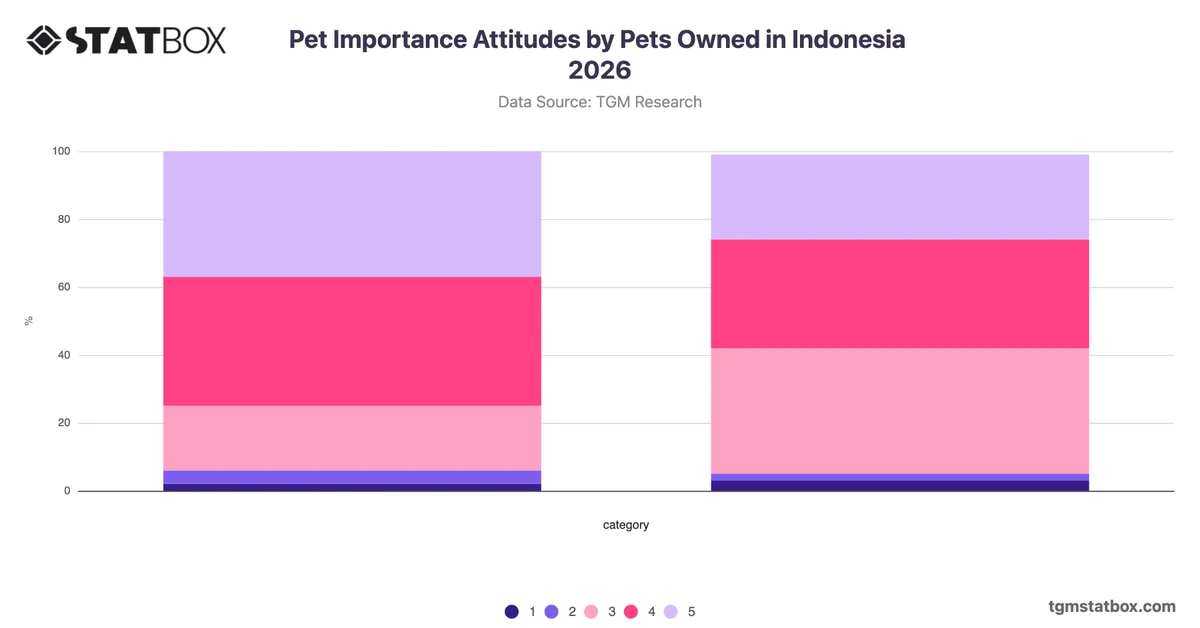
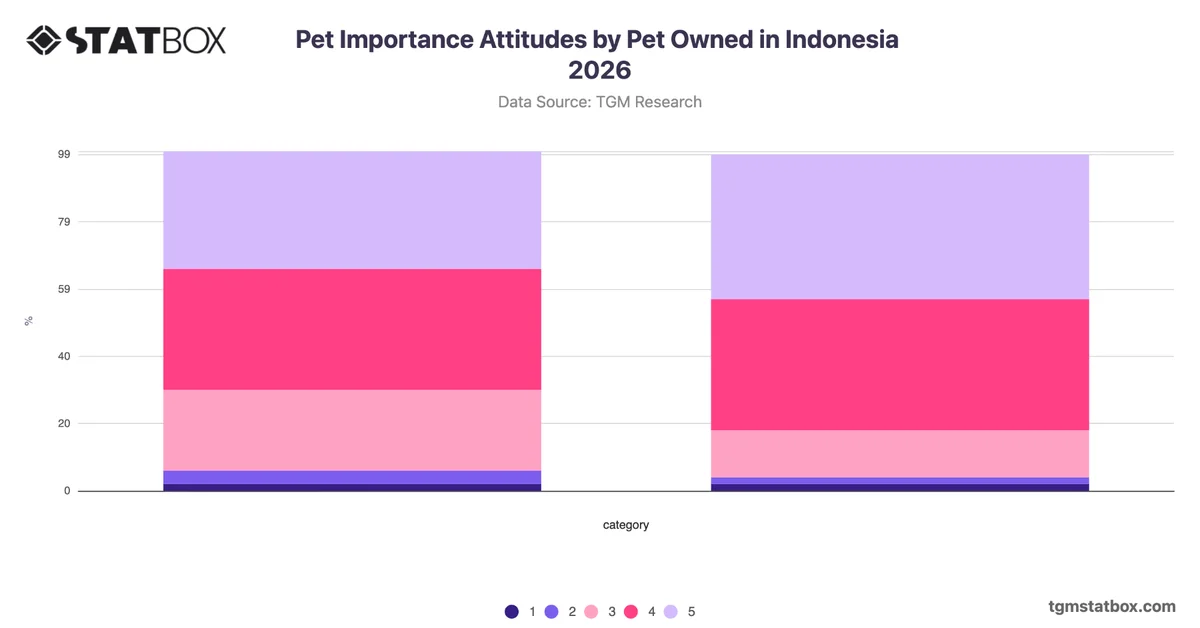
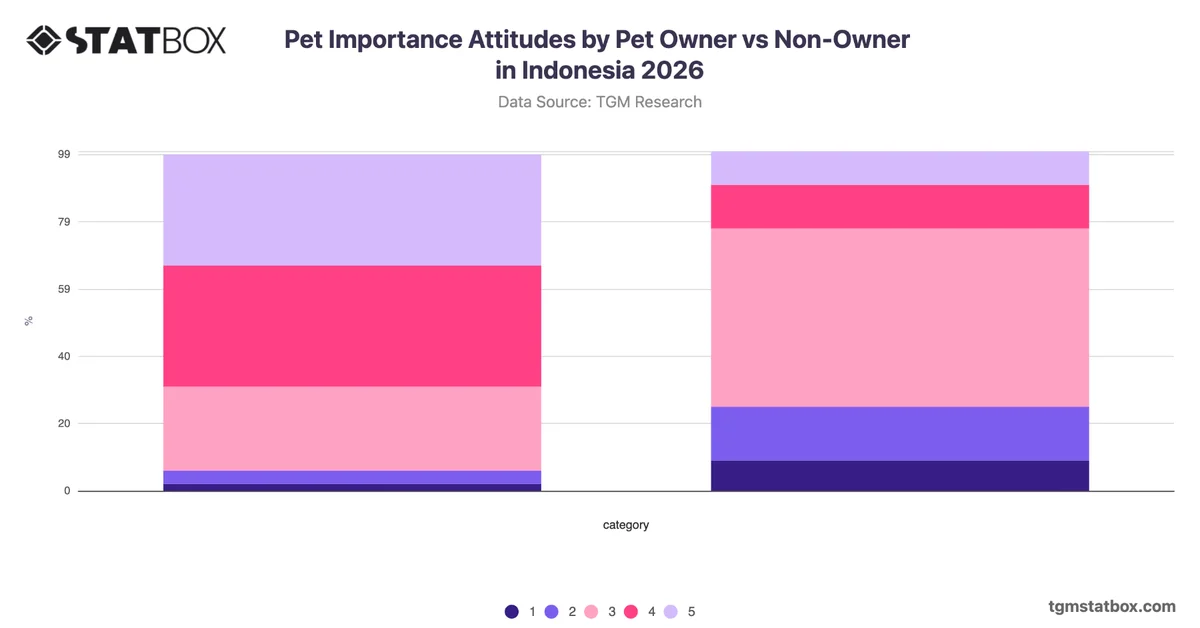
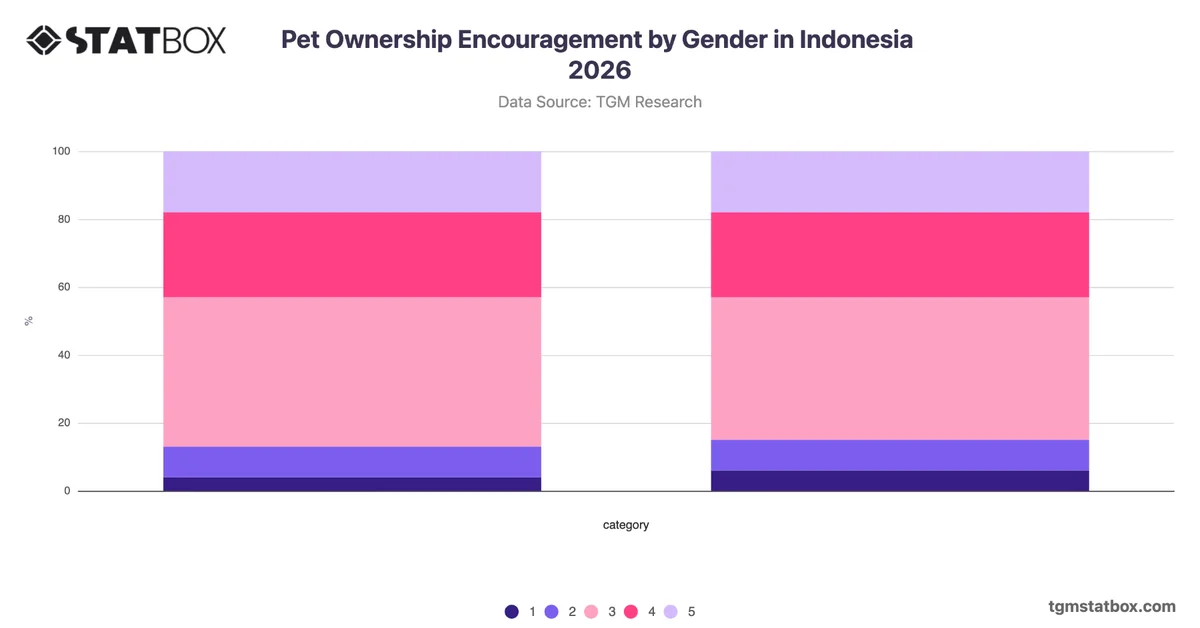
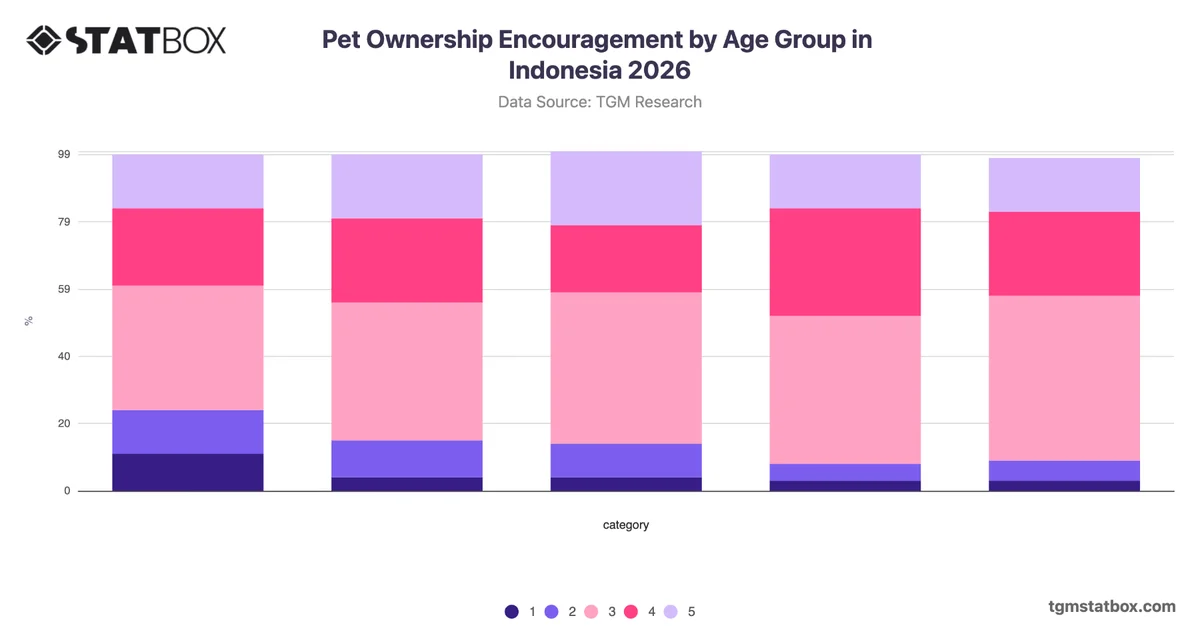
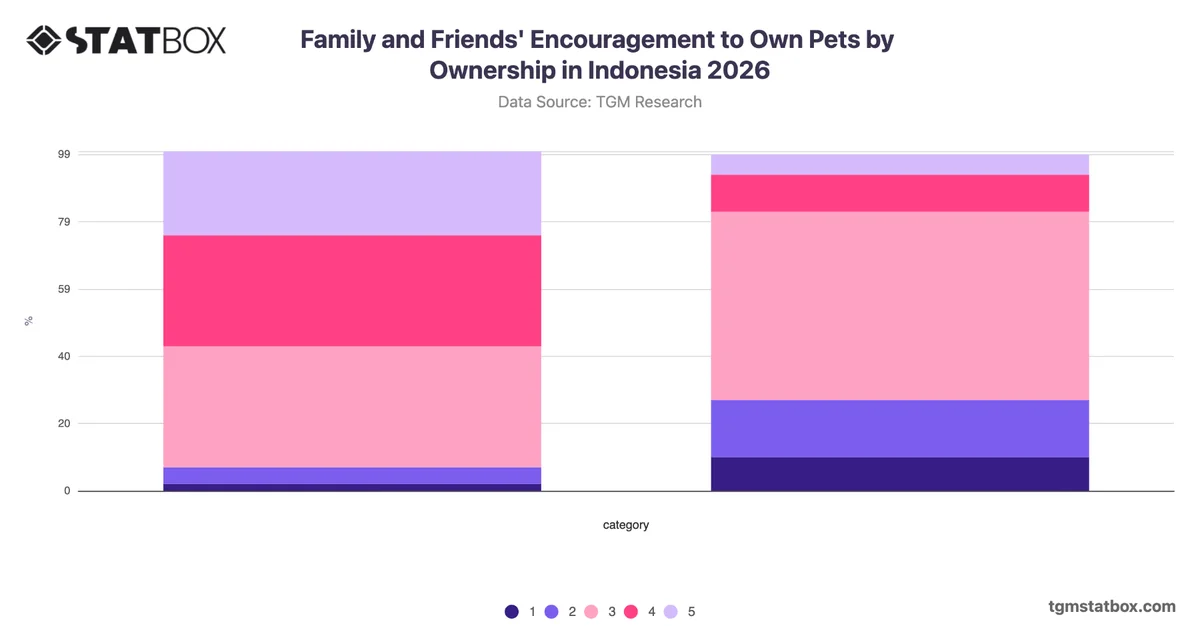
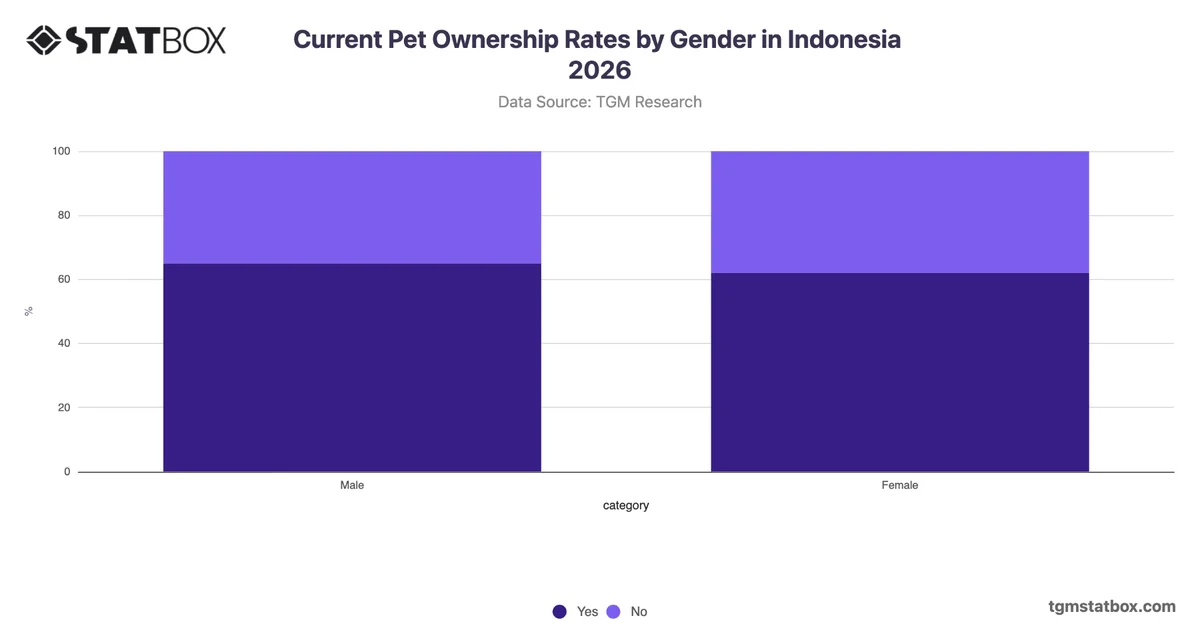
The most notable pattern in Indonesian attitudes toward pets is not a gender divide but a striking consistency between male and female respondents. Both groups cluster around the neutral midpoint, with approximately one in three selecting the middle response, while strong agreement, combining the top two positive categories, reaches roughly 53% among males and 51% among females, a difference too small to be analytically meaningful. Outright disagreement remains low for both groups, below 15% in each case. This concentration around moderate agreement, rather than strong conviction, suggests that pet attachment in Indonesia is broadly accepted as a social value but not yet deeply embedded as a personal priority for most respondents. For organisations developing pet-related products or communications, this pattern points to the importance of testing messages that reinforce personal relevance and emotional connection, rather than assuming an already committed consumer base.